Fig. 13
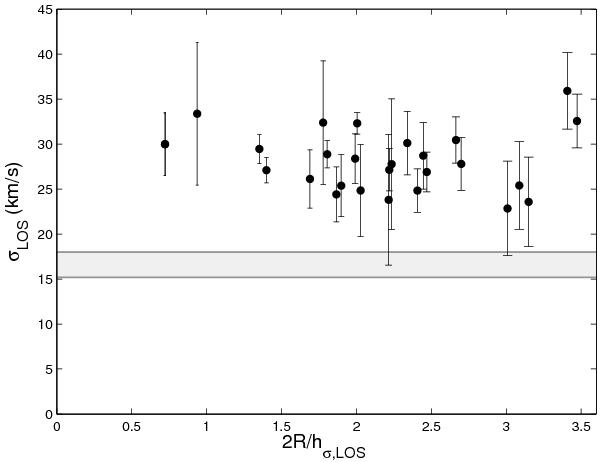
Measurements of σLOS that significantly deviates from the exponential decline. The grey band indicates the range in σinst; the σLOS measurements presented in this figure have not been corrected for the instrumental broadening to emphasize that these measurements are well above the instrumental resolution limit. One measurement from UGC 8196 at ~ 58 km s-1 is not plotted.
Current usage metrics show cumulative count of Article Views (full-text article views including HTML views, PDF and ePub downloads, according to the available data) and Abstracts Views on Vision4Press platform.
Data correspond to usage on the plateform after 2015. The current usage metrics is available 48-96 hours after online publication and is updated daily on week days.
Initial download of the metrics may take a while.