Fig. 12
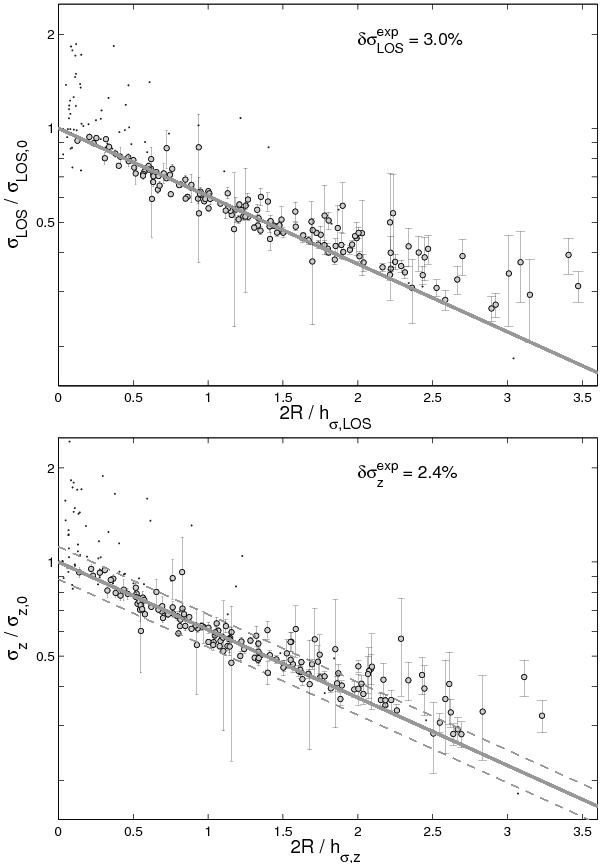
Velocity-dispersion profiles (top: σLOS, bottom: σz) for all galaxies. The plotted data are the seven azimuthally averaged values from Sect. 7.3.2 normalized by the fitted central velocity dispersion for each galaxy. The radius of each datum is scaled by half of the e-folding length of the exponential fit to its associated galaxy. Data likely affected by bulge kinematics, as well as all data from UGC 4458 and UGC 8196, are marked with smaller symbols (and no errors); these data have been excluded from the calculation of the scatter given near the top of each panel. The exponential model is plotted as a thick grey line with five times the scatter about this line shown as dashed lines. Points above the upper dashed line are plotted in Fig. 13. The models have not been fit directly to the data shown, but to the individual fiber measurements for every galaxy separately (see the Atlas).
Current usage metrics show cumulative count of Article Views (full-text article views including HTML views, PDF and ePub downloads, according to the available data) and Abstracts Views on Vision4Press platform.
Data correspond to usage on the plateform after 2015. The current usage metrics is available 48-96 hours after online publication and is updated daily on week days.
Initial download of the metrics may take a while.