Fig. 11
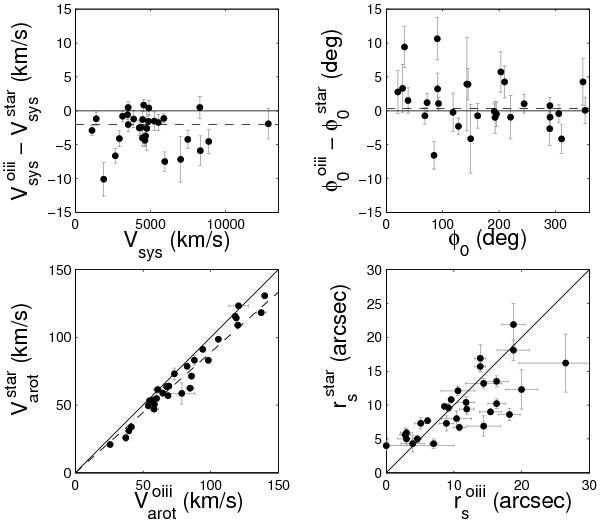
Differences between velocity-field model parameters for the stars and [Oiii]-emitting gas. The parameters compared are the systemic velocities (top left), position angles (top right), projected rotation velocity (bottom left) and rotation scale (bottom right). The systematic offset between the projected rotation speeds of the stars and gas is expected given the significant asymmetric drift of the stars. The average asymmetric drift,  , is indicated with a dashed line in the bottom left panel. Asymmetric drift should also result in a smaller scale radius for the [Oiii] rotation curve; however this trend is generally not seen, as discussed in the text. In the bottom-right panel, the point located on the vertical axis comes from UGC 4458, which has a declining gas rotation curve.
Current usage metrics show cumulative count of Article Views (full-text article views including HTML views, PDF and ePub downloads, according to the available data) and Abstracts Views on Vision4Press platform.
Data correspond to usage on the plateform after 2015. The current usage metrics is available 48-96 hours after online publication and is updated daily on week days.
Initial download of the metrics may take a while.