Fig. 6
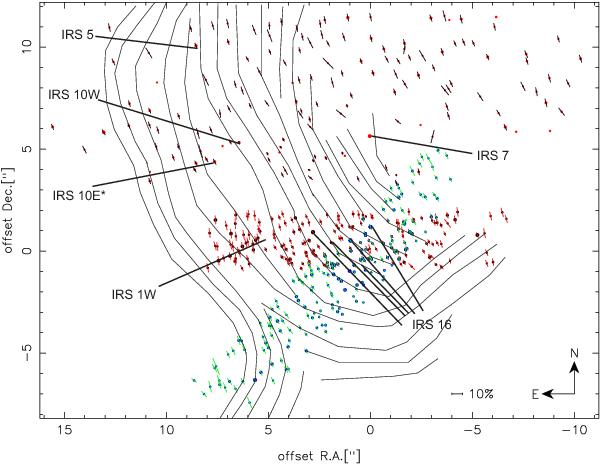
Ks-band polarization map of stars in the Galactic center. Only reliably measured polarization values are shown here. Black circles/red lines and blue circles/green lines: datasets presented in Buchholz et al. (2011). Red circles and black lines: new March 2011 Ks-band data. The diameter of the circles corresponds to the brightness of the source. Thin black lines in the background denote magnetic fields determined from mid-infrared (MIR) data (Aitken et al. 1998, based on a 1.5′′ beam). The brightest sources are also indicated.
Current usage metrics show cumulative count of Article Views (full-text article views including HTML views, PDF and ePub downloads, according to the available data) and Abstracts Views on Vision4Press platform.
Data correspond to usage on the plateform after 2015. The current usage metrics is available 48-96 hours after online publication and is updated daily on week days.
Initial download of the metrics may take a while.