Fig. 17
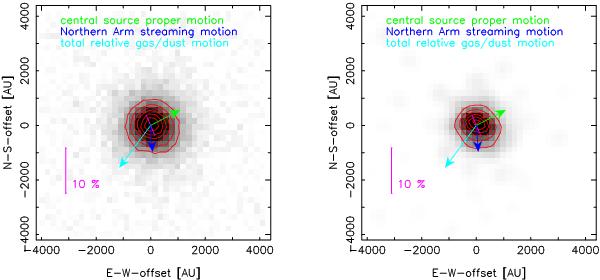
Left: Lp-band image of the MIR excess source IRS 5E before LR deconvolution. The arrows indicate the proper motions of the central source, the motion of the Northern Arm material and the motion of both relative to each other. The magenta line indicates the polarization. Right: The same source after LR deconvolution. The elongation of the source, the relative motion vector and the polarization all consistently indicate a bow-shock source. Contours indicate flux levels, in steps of 10% of the maximum flux.
Current usage metrics show cumulative count of Article Views (full-text article views including HTML views, PDF and ePub downloads, according to the available data) and Abstracts Views on Vision4Press platform.
Data correspond to usage on the plateform after 2015. The current usage metrics is available 48-96 hours after online publication and is updated daily on week days.
Initial download of the metrics may take a while.