Fig. 10
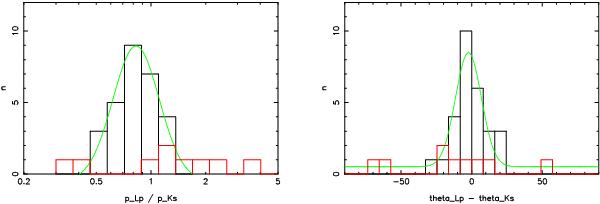
Left frame: relation of Lp- to Ks-band polarization degree (logarithmic plot). Right frame: difference between Lp- and Ks-band polarization angle. In both frames, the red columns represent suspected intrinsically polarized sources, while the black columns contain sources affected only by the foreground polarization. The green lines represent Gaussians fitted to the histograms.
Current usage metrics show cumulative count of Article Views (full-text article views including HTML views, PDF and ePub downloads, according to the available data) and Abstracts Views on Vision4Press platform.
Data correspond to usage on the plateform after 2015. The current usage metrics is available 48-96 hours after online publication and is updated daily on week days.
Initial download of the metrics may take a while.