Fig. 7
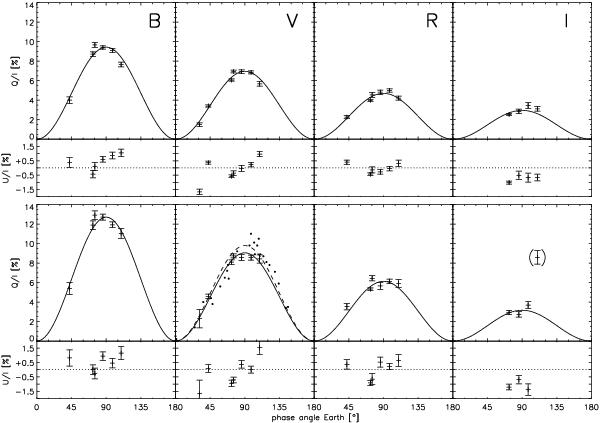
Fractional polarization Q/I and U/I of the earthshine measured for highland (top) and mare regions (bottom) for the four different filters B,V,R, and I (left to right). The solid curves are qmaxsin2 fits to the data. The error bars give the statistical 1σ noise Δnoise of the data, whereas the mare I band data at phase angle 109.5° are additionally affected by a substantial systematic offset Δsyst > 0.5%. The dots in the V panel for the mare region indicate the measurements of Dollfus (1957) and a corresponding qmaxsin2 fit (dashed line) is also given.
Current usage metrics show cumulative count of Article Views (full-text article views including HTML views, PDF and ePub downloads, according to the available data) and Abstracts Views on Vision4Press platform.
Data correspond to usage on the plateform after 2015. The current usage metrics is available 48-96 hours after online publication and is updated daily on week days.
Initial download of the metrics may take a while.