Fig. 5
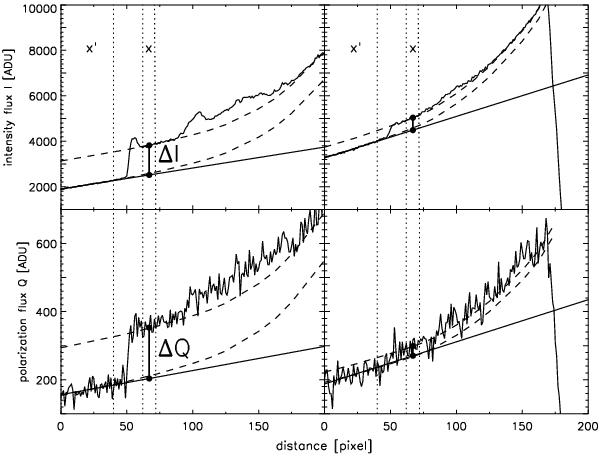
Measuring the earthshine signals ΔI, ΔQ for relatively low (phase 73°, region #1, filter B) and high (phase 98°, region #1, filter R) moonshine levels with the background x′ and measuring regions x indicated. The dashed lines illustrate the guessed level of the background (mainly stray light) and background plus constant earthshine regions (reflected from maria). The full line is the linear extrapolation of the measured background from the x′ to the x region.
Current usage metrics show cumulative count of Article Views (full-text article views including HTML views, PDF and ePub downloads, according to the available data) and Abstracts Views on Vision4Press platform.
Data correspond to usage on the plateform after 2015. The current usage metrics is available 48-96 hours after online publication and is updated daily on week days.
Initial download of the metrics may take a while.