Fig. 4
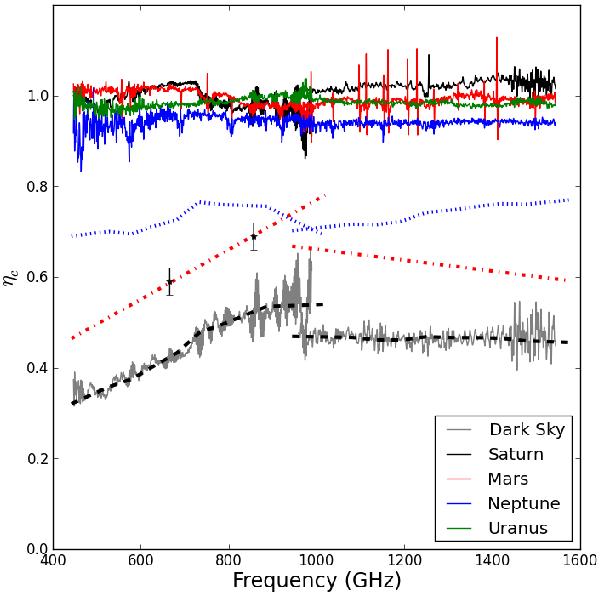
Correction efficiency ηc(ν,Ωsource) for the sources listed in Table 1 and dark sky (gray). The plot shows the variation of ηc with the frequency for each source. The blue dotted lines indicate the efficiency predicted by the optics model. The black dashed lines indicate a smoothed efficiency function of an extended source. The ratio between the two is indicated by the red dash dot lines. The two black stars are the far field efficiency measured from prototype arrays in the lab (Chattopadhyay et al. 2003).
Current usage metrics show cumulative count of Article Views (full-text article views including HTML views, PDF and ePub downloads, according to the available data) and Abstracts Views on Vision4Press platform.
Data correspond to usage on the plateform after 2015. The current usage metrics is available 48-96 hours after online publication and is updated daily on week days.
Initial download of the metrics may take a while.