Fig. 9
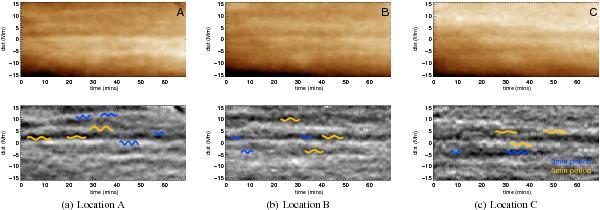
Transverse motions, obtained using perpendicular cuts through the chosen track on 11 April 2012, for the positions seen in Fig. 1b. Each frame of 193 Å data is unsharp masked, before both are sampled at the same cut location. The top row shows the variation of pure intensity, while the bottom row shows the corresponding unsharp mask image. Several features with periods close to 3 and 5 min have been highlighted in blue and yellow.
Current usage metrics show cumulative count of Article Views (full-text article views including HTML views, PDF and ePub downloads, according to the available data) and Abstracts Views on Vision4Press platform.
Data correspond to usage on the plateform after 2015. The current usage metrics is available 48-96 hours after online publication and is updated daily on week days.
Initial download of the metrics may take a while.