Fig. 3
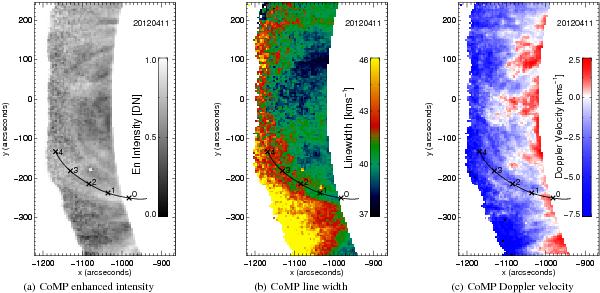
Typical snapshots of the quantities observed using CoMP; features seen in radially enhanced intensity a), line width b) and Doppler velocity c) in the region of interest on the solar limb (seen in Fig. 1a using AIA). Features seen in red in c) have been red-shifted, i.e. motion away from the observer (positive velocities) whereas blue corresponds to motion towards the observer (negative velocities).
Current usage metrics show cumulative count of Article Views (full-text article views including HTML views, PDF and ePub downloads, according to the available data) and Abstracts Views on Vision4Press platform.
Data correspond to usage on the plateform after 2015. The current usage metrics is available 48-96 hours after online publication and is updated daily on week days.
Initial download of the metrics may take a while.