Free Access
Fig. 12
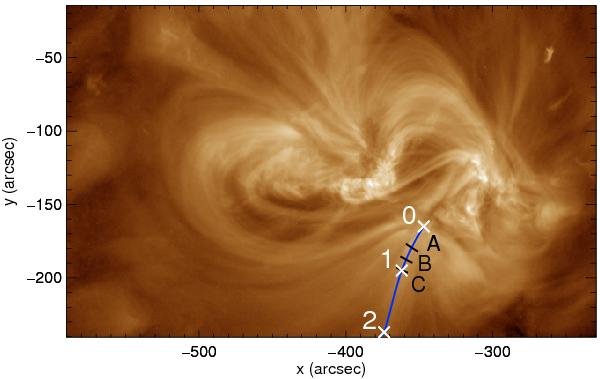
Southern AR, tracked onto the disk, seen in AIA 193 Å intensity at 15:33 UT on 14 April 2012, with fan loops anchored in the same region as those shown on the limb highlighted by the blue track. The location of several perpendicular cuts to this are also highlighted in black.
Current usage metrics show cumulative count of Article Views (full-text article views including HTML views, PDF and ePub downloads, according to the available data) and Abstracts Views on Vision4Press platform.
Data correspond to usage on the plateform after 2015. The current usage metrics is available 48-96 hours after online publication and is updated daily on week days.
Initial download of the metrics may take a while.