Fig. 11
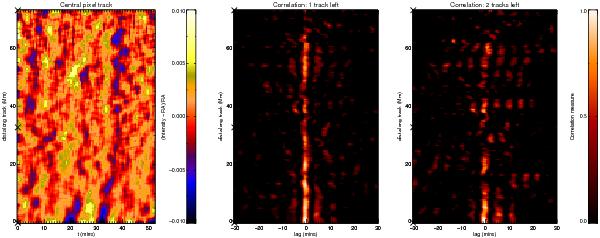
Space-time plots, illustrating the correlation between individual neighbouring tracks along fan loops on 11 April 2012. The left hand image illustrates the space-time image obtained by the central pixel in each perpendicular cut, while the middle and right hand images imply the correlation of this with a similar image obtained along neighbouring tracks.
Current usage metrics show cumulative count of Article Views (full-text article views including HTML views, PDF and ePub downloads, according to the available data) and Abstracts Views on Vision4Press platform.
Data correspond to usage on the plateform after 2015. The current usage metrics is available 48-96 hours after online publication and is updated daily on week days.
Initial download of the metrics may take a while.