Free Access
Fig. 10
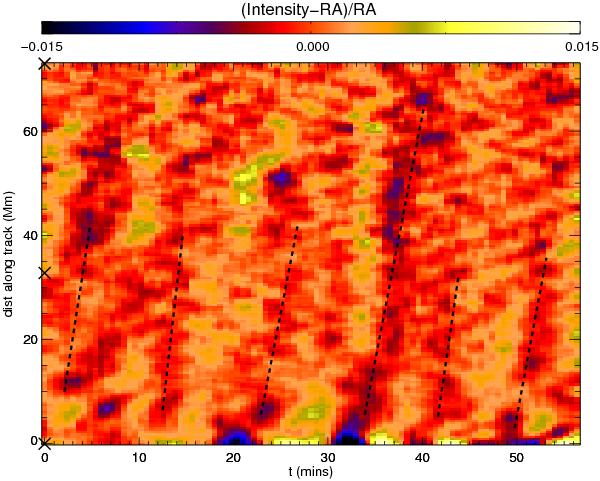
Quasi-periodic longitudinal features along fan loops above the limb on 11 April 2012 in AIA 193 Å. The dashed lines are used to estimate speeds and periods of the ridges; a 9 min running average has been used to establish amplitudes as a function of background intensity.
Current usage metrics show cumulative count of Article Views (full-text article views including HTML views, PDF and ePub downloads, according to the available data) and Abstracts Views on Vision4Press platform.
Data correspond to usage on the plateform after 2015. The current usage metrics is available 48-96 hours after online publication and is updated daily on week days.
Initial download of the metrics may take a while.