Free Access
Fig. 6
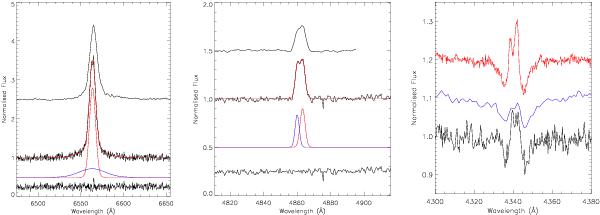
Left: Hα as seen with SALT (normalised) and according modelling with two Gaussians and continuum. The lowest line gives the residuals. The 2dF spectrum is shown on the top for comparison. Middle: same as before, but for Hβ. Right: Hγ as seen with VLT FLAMES (top), 2dF (middle) and SALT (bottom).
Current usage metrics show cumulative count of Article Views (full-text article views including HTML views, PDF and ePub downloads, according to the available data) and Abstracts Views on Vision4Press platform.
Data correspond to usage on the plateform after 2015. The current usage metrics is available 48-96 hours after online publication and is updated daily on week days.
Initial download of the metrics may take a while.