Fig. 4
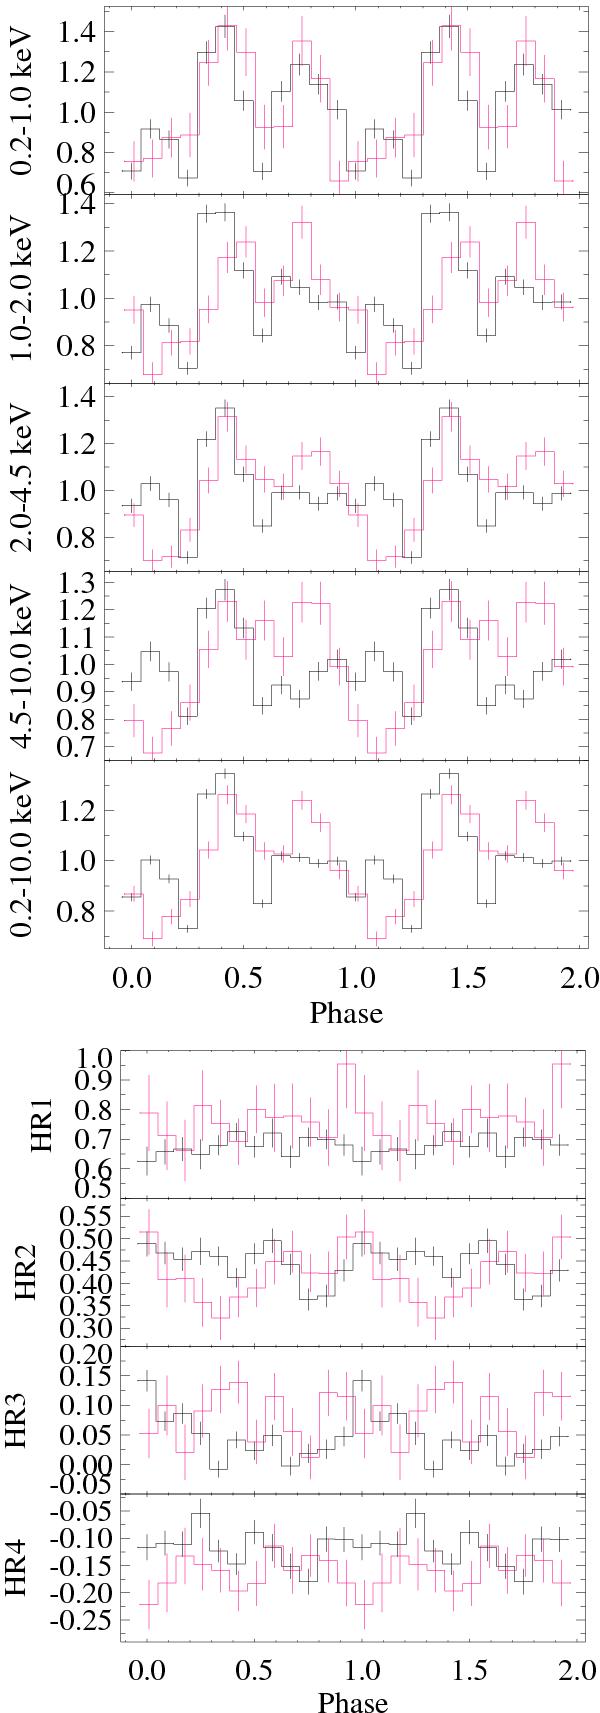
Upper figure: pulse profile of the time series, merged from all EPIC instruments in different energy bands for the 2012 observation (black) and an observation in 2010 (red). The individual light curves are background subtracted and normalised to the average count rate (from top to bottom: 0.19, 0.40, 0.44, 0.35, 1.37 cts s-1 in 2012 and 0.020, 0.044, 0.052, 0.037, 0.15 cts s-1 in 2010). Lower figure: hardness ratios as function of pulse phase.
Current usage metrics show cumulative count of Article Views (full-text article views including HTML views, PDF and ePub downloads, according to the available data) and Abstracts Views on Vision4Press platform.
Data correspond to usage on the plateform after 2015. The current usage metrics is available 48-96 hours after online publication and is updated daily on week days.
Initial download of the metrics may take a while.