Fig. 1
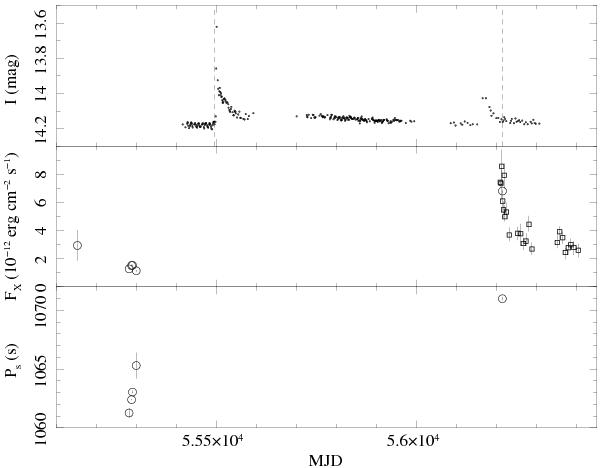
Upper panel: OGLE-IV I-band light curve. Dashed lines indicate the time of optical spectroscopy observations. Middle panel: X-ray fluxes in the (0.2−10.0) keV band from Swift (open squares) and XMM-Newton (open circles) including the 2009 slew-survey data and the 2010 measurements. Lower panel: NS spin period as measured with XMM-Newton.
Current usage metrics show cumulative count of Article Views (full-text article views including HTML views, PDF and ePub downloads, according to the available data) and Abstracts Views on Vision4Press platform.
Data correspond to usage on the plateform after 2015. The current usage metrics is available 48-96 hours after online publication and is updated daily on week days.
Initial download of the metrics may take a while.