Fig. 5
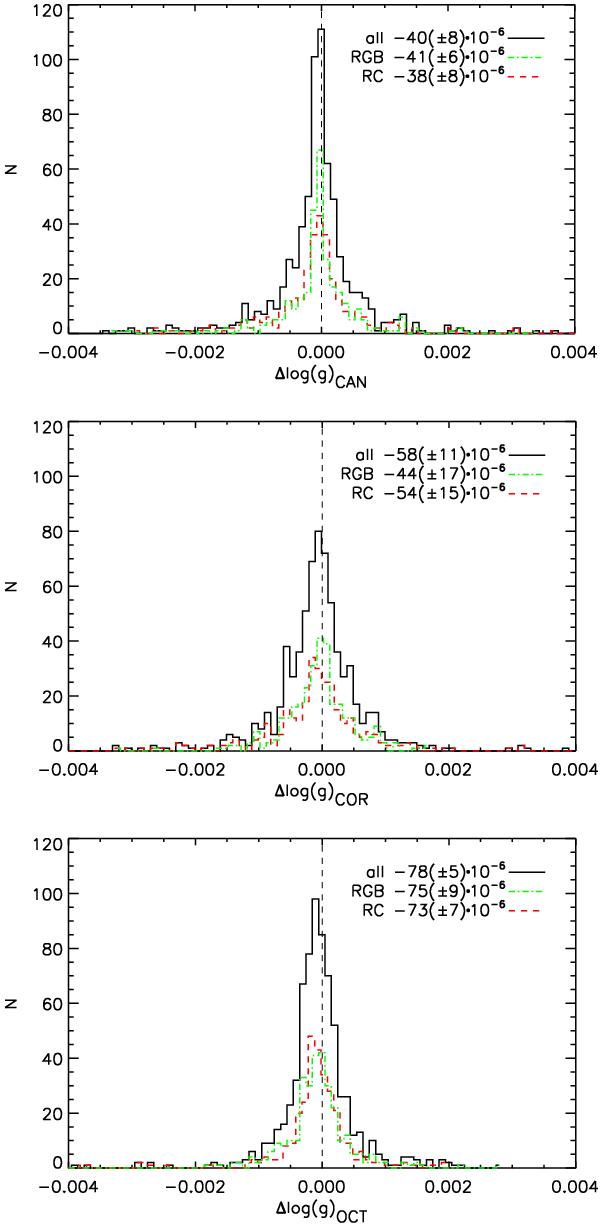
Histograms of the difference in log (g) obtained using grid-based modelling with the same method, but with and without the correction in the Δν scaling relation (White et al. 2011). From top to bottom: CAN, COR, and OCT. The central values of the distributions and formal 1σ uncertainties are given in the legend of each panel. The vertical dashed line indicates zero. The colour-coding is the same as in Fig. 2. Note that the horizontal scale has been expanded.
Current usage metrics show cumulative count of Article Views (full-text article views including HTML views, PDF and ePub downloads, according to the available data) and Abstracts Views on Vision4Press platform.
Data correspond to usage on the plateform after 2015. The current usage metrics is available 48-96 hours after online publication and is updated daily on week days.
Initial download of the metrics may take a while.