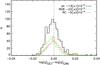
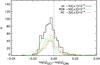
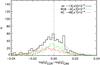
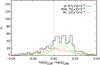
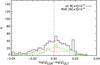
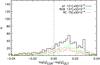
Fig. 2

Histograms of the difference in log (g) obtained with different methods (top row: OCT-CAN; centre row: COR-CAN; bottom row: COR-OCT) and with different solar reference values (left: canonical solar reference values (test 1); right: method specific solar reference values (test 2)). The black solid line indicates the complete sample, the red-dashed line the red-clump stars and the green-dashed-dotted line stars on the red-giant branch. We did not know the evolutionary phase for all the stars. The dotted lines show Gaussian fits to the distributions. The central value and formal 1σ uncertainties are given in the legend of each panel. A Gaussian fit through the RC data in the lower left panel did not properly represent the distribution so it is omitted. The vertical dashed line indicates zero difference.
Current usage metrics show cumulative count of Article Views (full-text article views including HTML views, PDF and ePub downloads, according to the available data) and Abstracts Views on Vision4Press platform.
Data correspond to usage on the plateform after 2015. The current usage metrics is available 48-96 hours after online publication and is updated daily on week days.
Initial download of the metrics may take a while.