Fig. 5
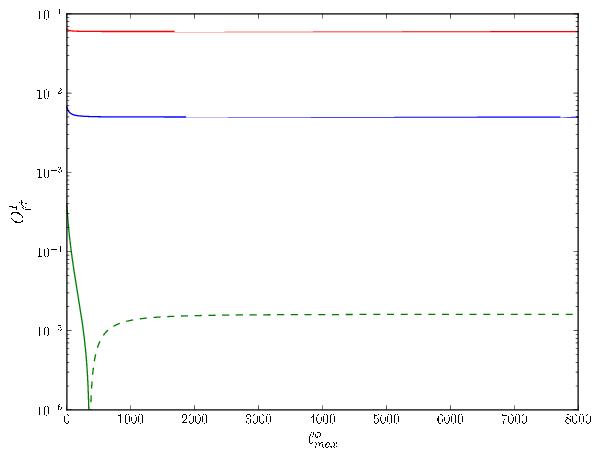
Example of the behavior of the offset term,
 , as a
function of
, as a
function of  for
for  (red), 2000 (blue),
4000 (green). The dashed part of the green line represents negative values.
(red), 2000 (blue),
4000 (green). The dashed part of the green line represents negative values.
 and
and
 have a
similar shape, but a different amplitude.
have a
similar shape, but a different amplitude.
Current usage metrics show cumulative count of Article Views (full-text article views including HTML views, PDF and ePub downloads, according to the available data) and Abstracts Views on Vision4Press platform.
Data correspond to usage on the plateform after 2015. The current usage metrics is available 48-96 hours after online publication and is updated daily on week days.
Initial download of the metrics may take a while.