Fig. 2
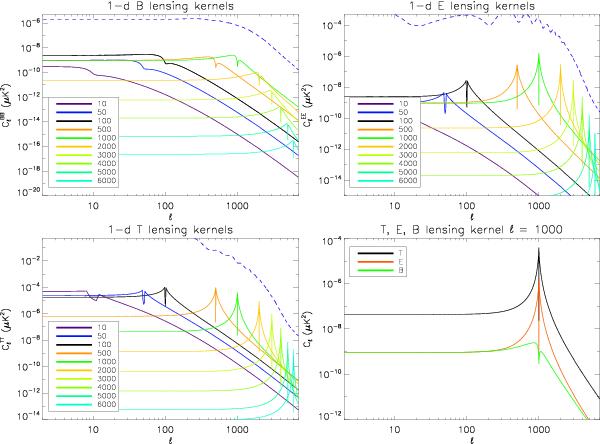
1D lensings kernels. The lensed power for T, E, and B spectra is computed assuming a delta-like spectra with power in a single mode ℓ′ = 10, 50, 100, 500, 1000, 2000, 3000, 4000, 5000 and 6000 in the unlensed CMB spectra. The blue dashed line represents the reference lensed spectra as computed by CAMB. The sum of all single-mode contributions for ℓ′ ∈ [0,∞] would reproduce the lensed spectra. For T and E cases, the subdominant contribution of the convolution part only is shown for visualization purposes and offset terms are ignored (see Sect. 3.2 and Eq. (20)). The comparison of 1D kernel shapes for T, E, and B for ℓ′ = 1000 is shown in the bottom-right panel: the peculiar shape of each type of kernel drives the locality and amplitude of the contribution to the lensed spectra.

Current usage metrics show cumulative count of Article Views (full-text article views including HTML views, PDF and ePub downloads, according to the available data) and Abstracts Views on Vision4Press platform.
Data correspond to usage on the plateform after 2015. The current usage metrics is available 48-96 hours after online publication and is updated daily on week days.
Initial download of the metrics may take a while.