Fig. 10
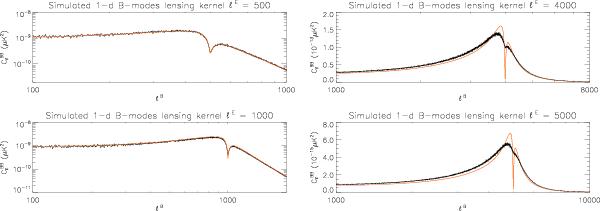
Comparison of the simulated, solid black lines, and analytical, solid red lines,
1D B-modes kernels,  , shown as a function of
 ,
and computed for the unlensed CMB E power contained initially
only in a single mode,
ℓ E = 500,1000,4000 and 5000. For
low values of ℓ E, left
panels, the agreement between the analytic expression, Eq. (12), and numerical results is very
good all the way to ℓB ≲ 2000, as
expected. For higher values of ℓ E,
though the agreement is poorer, it remains qualitatively very good, which
justifies our semi-analytic considerations presented in Sect. 3.
,
and computed for the unlensed CMB E power contained initially
only in a single mode,
ℓ E = 500,1000,4000 and 5000. For
low values of ℓ E, left
panels, the agreement between the analytic expression, Eq. (12), and numerical results is very
good all the way to ℓB ≲ 2000, as
expected. For higher values of ℓ E,
though the agreement is poorer, it remains qualitatively very good, which
justifies our semi-analytic considerations presented in Sect. 3.
Current usage metrics show cumulative count of Article Views (full-text article views including HTML views, PDF and ePub downloads, according to the available data) and Abstracts Views on Vision4Press platform.
Data correspond to usage on the plateform after 2015. The current usage metrics is available 48-96 hours after online publication and is updated daily on week days.
Initial download of the metrics may take a while.