Fig. 2
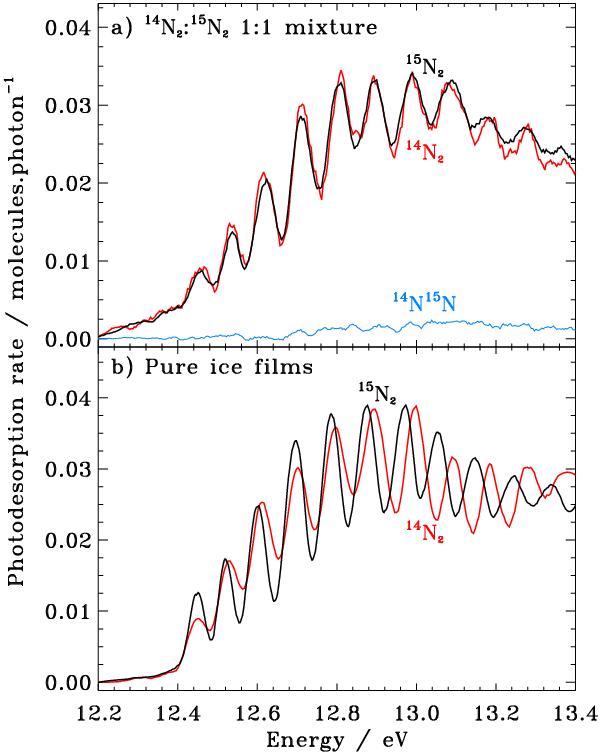
Photodesorption spectra of 15N2 (back line), 14N2 (red line), and 15N:14N (blue line) between 12.2 and 13.4 eV from a) a 60 ML-thick 15N2:14N2 1:1 ice at 14 K and b) pure 30 ML-thick 15N2 and 14N2 ice films at 14 K. The photodesorption spectra have been smoothed to facilitate comparisons between the vibrational progressions.
Current usage metrics show cumulative count of Article Views (full-text article views including HTML views, PDF and ePub downloads, according to the available data) and Abstracts Views on Vision4Press platform.
Data correspond to usage on the plateform after 2015. The current usage metrics is available 48-96 hours after online publication and is updated daily on week days.
Initial download of the metrics may take a while.