Free Access
Fig. 8
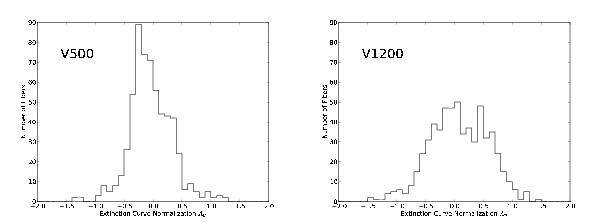
Distribution of normalization (AV) values in the aperture region (Fig. 6) for the CCM fits to the extinction curves in the fibers in the V500 (left) and V1200 (right) cube. Because the wavelength range is different for each cube, a different normalization can be expected.
Current usage metrics show cumulative count of Article Views (full-text article views including HTML views, PDF and ePub downloads, according to the available data) and Abstracts Views on Vision4Press platform.
Data correspond to usage on the plateform after 2015. The current usage metrics is available 48-96 hours after online publication and is updated daily on week days.
Initial download of the metrics may take a while.