Free Access
Fig. 7
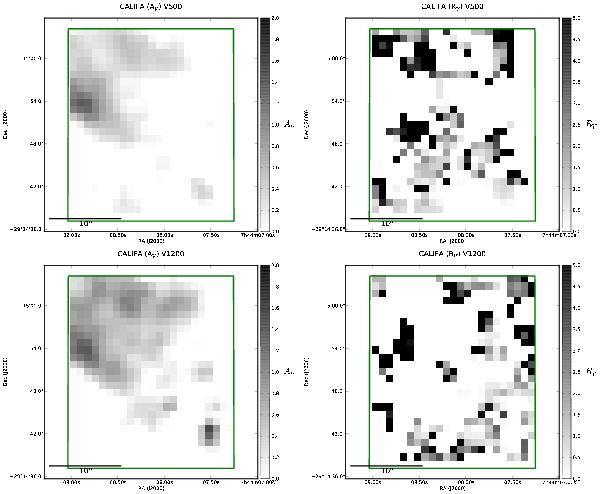
Maps of the normalization (AV) and slope (RV) of the CCM fit to the fiber extinction curves (τ = −1.086 × ln (OL/BG)) from the V500 and the V1200 cubes. The normalization follows the extinction map in Fig. 2 but the slope, RV is unrelated to the extinction in the HST image.
Current usage metrics show cumulative count of Article Views (full-text article views including HTML views, PDF and ePub downloads, according to the available data) and Abstracts Views on Vision4Press platform.
Data correspond to usage on the plateform after 2015. The current usage metrics is available 48-96 hours after online publication and is updated daily on week days.
Initial download of the metrics may take a while.