Fig. 2
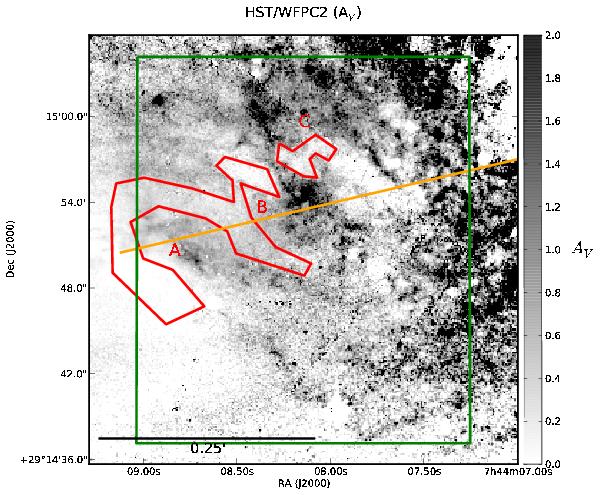
Extinction map, corresponding approximately to the overlap region marked in Fig. 1, in which we identified the inter-arm regions of UGC 3995B by eye (red polygon), surrounding complex A and B in Fig. 2. The orange line shows where the transmission curve from the center of UGC 3995A to the center of UGC 3995B, shown in Fig. 3, was taken.
Current usage metrics show cumulative count of Article Views (full-text article views including HTML views, PDF and ePub downloads, according to the available data) and Abstracts Views on Vision4Press platform.
Data correspond to usage on the plateform after 2015. The current usage metrics is available 48-96 hours after online publication and is updated daily on week days.
Initial download of the metrics may take a while.