Free Access
Fig. 10
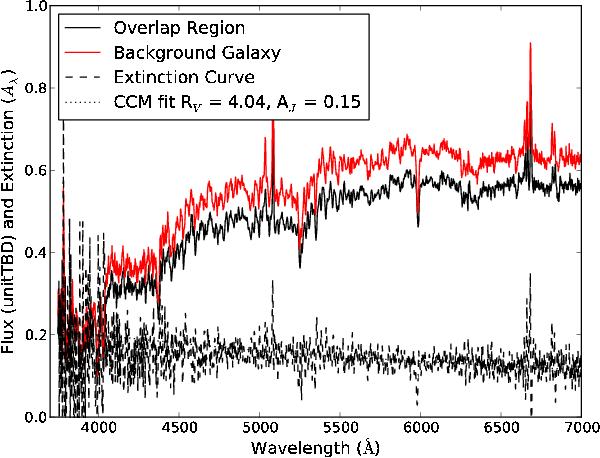
Good example of two fiber spectra from the V500 cube: one fiber spectrum from the overlap region (OL, black solid line), its counterpart in a corresponding background fiber (BG, red solid line) and the resulting extinction curve (dashed line) and CCM fit to that extinction curve (dotted line).
Current usage metrics show cumulative count of Article Views (full-text article views including HTML views, PDF and ePub downloads, according to the available data) and Abstracts Views on Vision4Press platform.
Data correspond to usage on the plateform after 2015. The current usage metrics is available 48-96 hours after online publication and is updated daily on week days.
Initial download of the metrics may take a while.