Fig. 8
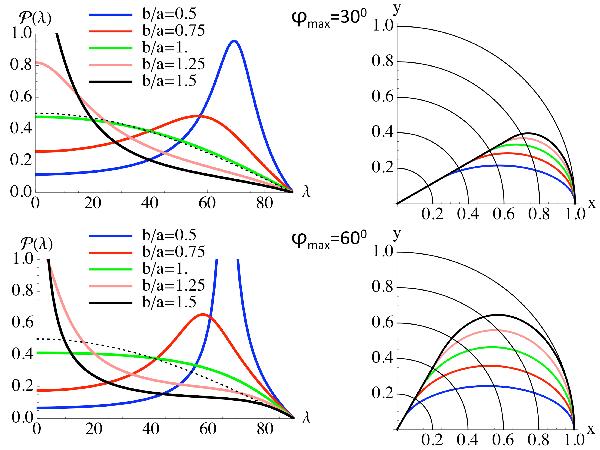
Probability distribution of the location angle λ (left
panels) and the corresponding axis shape (right panels)
for the elliptical model of the flux rope axis (defined in Fig. 7). Since the model is symmetric,
 so that only the part λ > 0 is shown. The
distributions are normalized so that the integral of
so that only the part λ > 0 is shown. The
distributions are normalized so that the integral of
 is unity. Five cases with different values of the aspect ratio
(b/a) of the ellipse are shown
with solid curves, for two maximum extension ϕmax of the
angle ϕ (defined in Fig. 7). The
dotted curve represents the distribution for a circular front and low
ϕmax values (cosinus function, see Sect. 3.3).
is unity. Five cases with different values of the aspect ratio
(b/a) of the ellipse are shown
with solid curves, for two maximum extension ϕmax of the
angle ϕ (defined in Fig. 7). The
dotted curve represents the distribution for a circular front and low
ϕmax values (cosinus function, see Sect. 3.3).
Current usage metrics show cumulative count of Article Views (full-text article views including HTML views, PDF and ePub downloads, according to the available data) and Abstracts Views on Vision4Press platform.
Data correspond to usage on the plateform after 2015. The current usage metrics is available 48-96 hours after online publication and is updated daily on week days.
Initial download of the metrics may take a while.