Fig. 6
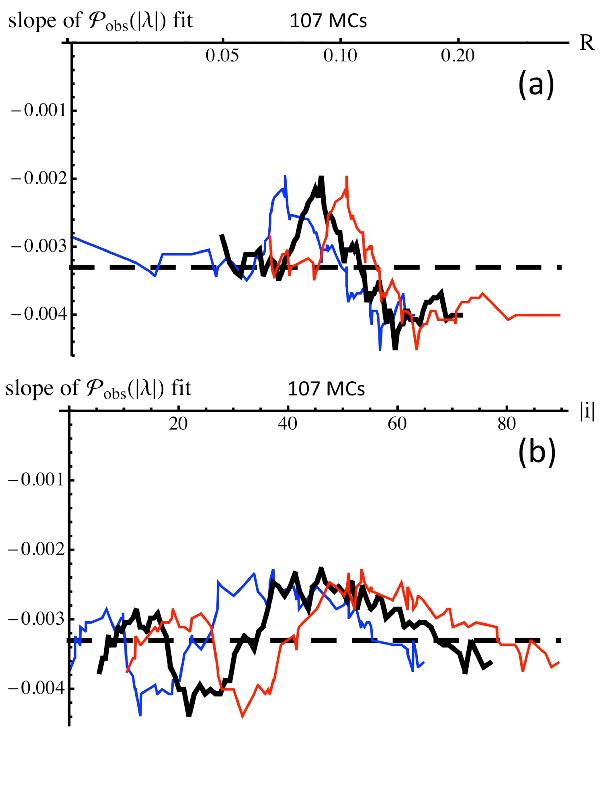
Property of the probability distribution  ,
parametrized by the slope of the linear fit (see the straight black line in Fig.
5a). This slope is shown here as a function
of two selected MC parameters. The MCs are first ordered by growing order of one
parameter, then they are split into subsets of 20 MCs, shifting progressively the
mean parameter to higher values. The two selected parameters are the flux rope
radius (R in AU, top panel) and the absolute value
of the inclination angle (| i |, bottom panel).
The three curves represent the slope of the fit, with the black line corresponding
to the mean value of R (| i | for bottom
panel) for each subset, and the blue (resp. red) line corresponding to
the minimum (resp. maximum) of R (| i | for
bottom panel) value for each subset. The horizontal dashed line
is the slope for all MCs (black line slope in the top panel of Fig. 5).
,
parametrized by the slope of the linear fit (see the straight black line in Fig.
5a). This slope is shown here as a function
of two selected MC parameters. The MCs are first ordered by growing order of one
parameter, then they are split into subsets of 20 MCs, shifting progressively the
mean parameter to higher values. The two selected parameters are the flux rope
radius (R in AU, top panel) and the absolute value
of the inclination angle (| i |, bottom panel).
The three curves represent the slope of the fit, with the black line corresponding
to the mean value of R (| i | for bottom
panel) for each subset, and the blue (resp. red) line corresponding to
the minimum (resp. maximum) of R (| i | for
bottom panel) value for each subset. The horizontal dashed line
is the slope for all MCs (black line slope in the top panel of Fig. 5).
Current usage metrics show cumulative count of Article Views (full-text article views including HTML views, PDF and ePub downloads, according to the available data) and Abstracts Views on Vision4Press platform.
Data correspond to usage on the plateform after 2015. The current usage metrics is available 48-96 hours after online publication and is updated daily on week days.
Initial download of the metrics may take a while.