Fig. 5
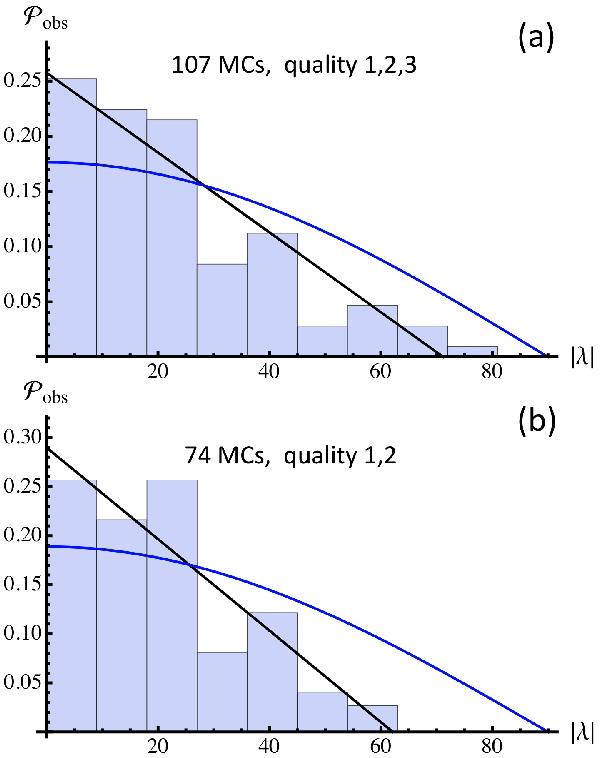
Probability distribution,  ,
of the location angle (λ) as derived from the magnetic data of MCs
observed at 1 AU and fitted by the Lundquist model (Lepping et al. 1990). The data are grouped into a histogram having 10 bins
of |λ| and
is normalized so that the sum of the bins is unity. A least square fit of the
histogram with a straight line and a cosinus function are shown in black and blue,
respectively.
,
of the location angle (λ) as derived from the magnetic data of MCs
observed at 1 AU and fitted by the Lundquist model (Lepping et al. 1990). The data are grouped into a histogram having 10 bins
of |λ| and
is normalized so that the sum of the bins is unity. A least square fit of the
histogram with a straight line and a cosinus function are shown in black and blue,
respectively.
Current usage metrics show cumulative count of Article Views (full-text article views including HTML views, PDF and ePub downloads, according to the available data) and Abstracts Views on Vision4Press platform.
Data correspond to usage on the plateform after 2015. The current usage metrics is available 48-96 hours after online publication and is updated daily on week days.
Initial download of the metrics may take a while.