Fig. 3
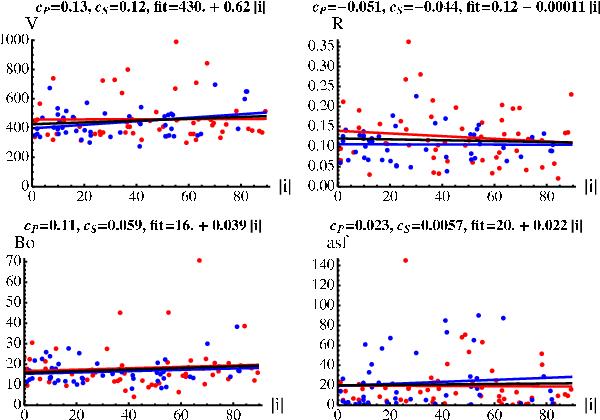
Properties of MCs observed at 1 AU versus the axis inclination on the ecliptic (i in degree). The correlations are shown for the mean MC velocity (V in km s-1), the MC radius (R in AU), the axial magnetic field strength (B0 in nT), and the asymmetry factor (asf in %) for the full set of MCs. The asymmetry factor (asf, see Lepping et al. 2005) measures twice the time difference between the middle of the MC time interval and the closest approach (“center time”). It is expressed in % of the MC event duration. It has been introduced to measure how far in time the peak in the modeled magnetic field is from the midpoint of observed MC. The drawing convention is the same as in Fig. 2.
Current usage metrics show cumulative count of Article Views (full-text article views including HTML views, PDF and ePub downloads, according to the available data) and Abstracts Views on Vision4Press platform.
Data correspond to usage on the plateform after 2015. The current usage metrics is available 48-96 hours after online publication and is updated daily on week days.
Initial download of the metrics may take a while.