Fig. 2
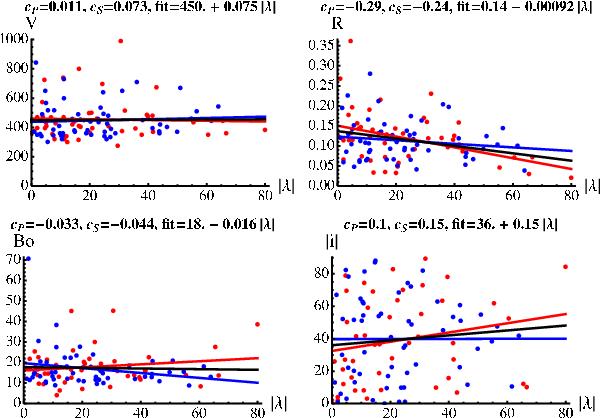
Properties of MCs observed at 1 AU versus the location angle (λ in degree). The correlations are shown for the mean MC velocity (V in km s-1), the MC radius (R in AU), the axial magnetic field strength (B0 in nT), and the axis inclination (i in degree) for the full set of MCs. λ > 0 and λ < 0 are shown in red and blue, respectively, and the abscissa, |λ|, allows comparing the two leg sides of the flux rope (Fig. 1c). The straight lines are linear fits to the data points (MCs) showing the tendency. The results with the total MC set are shown in black (linear fit and top labels). cP and cS are the Pearson and Spearman rank correlation coefficients, respectively, and “fit” is the least-square fit of a straight line (in black) to the full data set.
Current usage metrics show cumulative count of Article Views (full-text article views including HTML views, PDF and ePub downloads, according to the available data) and Abstracts Views on Vision4Press platform.
Data correspond to usage on the plateform after 2015. The current usage metrics is available 48-96 hours after online publication and is updated daily on week days.
Initial download of the metrics may take a while.