Fig. 12
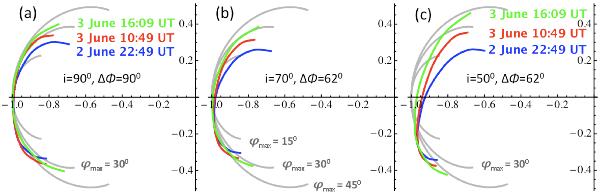
Comparison of the axis shape deduced from in situ measurements of MCs (gray curves) and from the CME observed by STEREO-A HI1 on 2–3 june 2008 (colored curves, the image corresponding to the red curve is shown in Fig. 11). The panels are in the plane of the flux rope axis. We use different geometry to deduce the shape of the axis: a) conic projection on the plane of the sky, b–c) axis plane being inclined on the ecliptic by an angle i and crossing the ecliptic at a longitude Δφ from STEREO-A (see Sect. 5.3).
Current usage metrics show cumulative count of Article Views (full-text article views including HTML views, PDF and ePub downloads, according to the available data) and Abstracts Views on Vision4Press platform.
Data correspond to usage on the plateform after 2015. The current usage metrics is available 48-96 hours after online publication and is updated daily on week days.
Initial download of the metrics may take a while.