Fig. 11
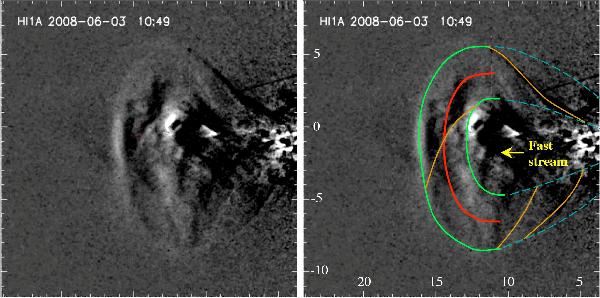
Observational example of a flux rope observed by STEREO-A HI1. The image is derived with running differences. In the right panel, the same image is shown with the front and rear sheaths outlined with green lines. The dashed blue lines are extrapolations towards the Sun. The flux rope axis (red line) is defined at equidistance from the two sheaths. Four twisted structures are marked with orange lines. The coordinate system is the elongation angle in degree from the Sun. This figure is adapted from Möstl et al. (2009).
Current usage metrics show cumulative count of Article Views (full-text article views including HTML views, PDF and ePub downloads, according to the available data) and Abstracts Views on Vision4Press platform.
Data correspond to usage on the plateform after 2015. The current usage metrics is available 48-96 hours after online publication and is updated daily on week days.
Initial download of the metrics may take a while.