Fig. 10
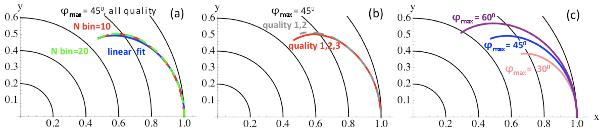
Mean flux-rope axis deduced from the probability distribution
 shown in Fig. 5. a) Comparison of
the axis deduced from a linear fit and from a spline interpolation of
with 10 and 20 bins for 107 MCs. b) Comparison of the axis deduced
directly from
with 10 bins for all and quality 1,2 MCs, so from the two distributions shown in
Fig. 5. c) Effect of changing the
free parameter ϕmax.
shown in Fig. 5. a) Comparison of
the axis deduced from a linear fit and from a spline interpolation of
with 10 and 20 bins for 107 MCs. b) Comparison of the axis deduced
directly from
with 10 bins for all and quality 1,2 MCs, so from the two distributions shown in
Fig. 5. c) Effect of changing the
free parameter ϕmax.
Current usage metrics show cumulative count of Article Views (full-text article views including HTML views, PDF and ePub downloads, according to the available data) and Abstracts Views on Vision4Press platform.
Data correspond to usage on the plateform after 2015. The current usage metrics is available 48-96 hours after online publication and is updated daily on week days.
Initial download of the metrics may take a while.