| Issue |
A&A
Volume 556, August 2013
|
|
|---|---|---|
| Article Number | A108 | |
| Number of page(s) | 10 | |
| Section | Galactic structure, stellar clusters and populations | |
| DOI | https://doi.org/10.1051/0004-6361/201321405 | |
| Published online | 05 August 2013 | |
Spectroscopic observations of blue stars with infrared excesses in NGC 6611
1
Dipartimento di Fisica e ChimicaUniversità di Palermo,
P.zza del Parlamento 1,
90134
Palermo,
Italy
e-mail:
This email address is being protected from spambots. You need JavaScript enabled to view it.
2
INAF – Osservatorio Astronomico di Palermo, P.zza del Parlamento
1, 90134
Palermo,
Italy
3 Smithsonian Astrophysical Observatory − SAO, 60 Garden St,
Cambridge, MA02138, USA
Received: 4 March 2013
Accepted: 5 June 2013
Abstract
Context. The young open cluster NGC 6611 includes a group of peculiar objects with interesting properties among its candidate members: blue stars with infrared (IR) excesses. These stars show excesses in IR bands, a signature of the presence of a circumstellar disk, but optical colors typical of older field stars. To confirm their membership in the cluster, it is therefore important to use new spectroscopic observations, together with previous photometric data.
Aims. We aim to confirm the membership of these objects and investigate their physical properties to verify whether the observed colors are intrinsic or altered by the disk or by the accretion processes.
Methods. We analyzed the intermediate-resolution spectroscopic data obtained for a subsample of blue stars in NGC 6611 with FLAMES. In particular, we focused on the study of 1) the profile of the Hα emission line, to select stars with accretion and outflow activity; 2) the Li absorption line, used as a youth indicator; 3) the radial velocity.
Results. Using the spectroscopic analysis, it has been possible to investigate the Li absorption line, as well as to distinguish between stars with inert or active disks. In particular, from the analysis of the Hα emission line we were able to infer the activity due to the accretion and outflow processes and the variability of the emission. We also investigated the binarity of the blue stars and their membership to NGC 6611.
Conclusions. From our spectroscopic analysis, we conclude that half of the sample of blue stars (10/20) are confirmed members of NGC 6611 (with 6 more stars that could also be possible members). In conclusion, our results indicate that members of young clusters can also be found in an anomalous region of the color−magnitude diagram, i.e., outside of the pre-main sequence locus where most of the cluster members lie.
Key words: stars: formation / stars: pre-main sequence / accretion, accretion disks
© ESO, 2013
1. Introduction
The evolution of stars in the pre-main sequence (PMS) phase can be investigated by studying the properties of young stellar objects (YSOs) in star forming regions. Spectral analysis of young clusters can shed light on the accretion properties of YSOs, in particular in the age range 1−10 Myr, i.e., when the YSOs lose their disks and the accretion process stops (Hartmann et al. 1998). Disk evolution and properties are also interesting in the wider context of planetary formation.
In this paper we focus on the NGC 6611 cluster. This cluster and its parental cloud M 16 (the Eagle Nebula) have been deeply investigated in the past and the main parameters derived in detail (Guarcello et al. 2007, 2010). The authors estimated a distance of 1750 pc, a median age of ~1 Myr, and an average disk frequency of ≈36%. This value increases, however, far from the OB stars. Previous studies of the central region of NGC 6611 claim a wide age spread, <1−3 Myrs (Indebetouw et al. 2007) and different values for the disk frequency, 58% (Oliveira et al. 2005).
In this paper, we study the nature of a group of stars, called Blue With infrared Excesses (BWE), found in NGC 6611 by Guarcello et al. (2010). Young stars associated with NGC 6611 were selected by those authors (see Sect. 2) by analyzing their photometric data, by checking their infrared (IR) excesses, which are a signature of the presence of a circumstellar disk, and their detection in the X-ray band. The stars with IR excesses are consistent with ages “apparently” older than the cluster age, i.e., with colors bluer than those predicted by the 5 Myr isochrone (chosen to be conservative) of Siess et al. (2000) at the distance and extinction of the cluster. Our aim is to understand whether these stars are members of NGC 6611 and whether their “anomalous” position on the color−magnitude diagram (CMD) is due to the presence of the circumstellar disk and/or to the accretion process; or if their colors are purely photospheric they lead to the conclusion that these stars are older than the other stars of the cluster.
The use of spectroscopic data is necessary to distinguish between classical T Tauri stars (CTTSs) and weak line T Tauri stars (WTTSs). In fact, with only photometric data it is not possible to distinguish between these two classes, since we know that there are stars with a disk that do not show accretion activity. Indeed, the fraction of disks without accretion activity grows with age (Sacco et al. 2008). This implies different timescales for the two effects, the lifetime of the circumstellar disk and the accretion timescales. In particular, the spectroscopic analysis allows us to study the Hα emission line, which is important since we can infer the accretion and outflow from its profile. In fact, CTTSs spectra show broad Hα emission lines due to the accretion and outflow processes, while WTTSs do not show any feature of accretion or of outflow. Furthermore, spectra containing the absorption Li line allow us to distinguish between young and old stars, since the presence of this line is an indicator of youth. In fact, during the PMS, in stars with M < 1.2 M⊙ (where the convective region is more extended), the Li in the stellar surface reaches the internal region where it is destroyed. The process is very efficient, in particular in totally convective stars with mass between 0.2−0.5 M⊙ where the Li is depleted in 5−10 Myr (Bodenheimer 1965; Siess et al. 2000).
Several interpretations have been proposed to explain the nature of the BWE stars (see Guarcello et al. 2010, for details). One hypothesis is that the V band can be altered by accretion activity. In particular, the photospheric colors of the stars can be modified by the veiling effect (as in the Taurus-Auriga complex discussed by Hartmann & Kenyon 1990). Furthermore, the scattering and the obscuration due to the disk can affect the optical bands more than the IR bands, leading to a bluer V − I than expected. In fact, scattering due to small dust grains in circumstellar disks can cause an increase in the optical flux at shorter wavelengths (Throop et al. 2001), while the obscuration due to a high inclination angle of the disk can reduce the photospheric flux, absorbing part of the stellar radiation, without altering the (V − I) colors, therefore the scattering can make the emission bluer, while the obscuration makes the optical emission fainter.
It is worth noting that a mismatch between the optical and the IR catalogs could misinterpret MS optical foreground stars as BWE candidate members. This can happen since the most probable mismatch occurs between a foreground optical source and a background IR source. The combined spectral energy distribution (SED) can resemble that of a YSO with large IR excesses, which will be easily detected by the selection criteria adopted in Guarcello et al. (2007), which combine and compare optical and IR colors. Since all the optical data have been collected during the same night (Guarcello et al. 2007), no photometric variability can be considered as a cause for the observed blue V − I colors. If the BWE stars were old cluster members, this should be evidence of age spread, and this is crucial for constraining the theoretical models of cluster formation (e.g. Shu et al. 1987; Tassis & Mouschovias 2004; Ballesteros-Paredes & Hartmann 2007).
The consequences of our study are of general interest, because BWE stars are typically excluded from cluster memberships based on photometric data. If a significant fraction of the BWE stars analyzed here are spectroscopically confirmed members of NGC 6611, this will imply that not including them among candidate members creates a serious problem for completeness, with consequences for any studies, for instance, of the IMF and cluster dynamics.
We note that stars with properties similar to those of BWE stars have been observed not only in NGC 6611 but also in other clusters (as in the ONC, Hillenbrand 1997; see also Sect. 5 for more examples), therefore the analysis discussed here has a wide application.
2. Target selection and observations
In the context of the ESO program Obs. ID: 083.C-0837 (P.I.: Guarcello), we observed a sample of 194 candidate members of the cluster NGC 6611, selected from the Guarcello et al. (2010) catalog, with the aim of deriving their spectroscopic properties. Disk-bearing cluster members were selected from Guarcello et al. (2007, 2009, 2010) adopting two criteria: the IRAC [3.6]−[4.5] vs. [5.8]−[8.0] diagram and a set of reddening-free color indices. In the IRAC color−color diagram the locus of normal-color stars, reddened photospheres, and disk-bearing objects can be easily separated, resulting in a robust selection suffering a small contamination (Allen et al. 2004). The set of reddening free color indices used for the selection is defined in Damiani et al. (2006) and Guarcello et al. (2007, 2009). Since a detailed explanation of the properties of these indices is beyond the scope of this paper, we just summarize their main characteristics. The reader is referred to these papers for more details. Each of these indices is defined in order to compare an optical color, representative of the photospheric emission, with an IR color. Normal stars have indices with positive values even at large extinctions, while the indices become more negative when stars have IR excesses, because it is possible to build diagrams where the locus of the reddened stars is distinguished well from that of the disk-bearing objects. Besides that, the indices are particularly effective (Guarcello et al. 2010) in selecting stars whose optical colors are affected by accretion or presence of light scattered into the line of sight by the disk itself.
While most of these sources show ages in agreement with the cluster age (<5 Myr), a subsample of 90 stars with disk show optical colors typical of objects older than the remaining cluster members (the BWE stars). In this paper we analyze 20 of these stars suitable for FLAMES observations. Table 1 shows the list of the 20 BWE stars analyzed here with the related B, V, and I magnitudes.
List of the 20 BWE stars observed with FLAMES and their B, V, and I magnitudes.
Figure 1 shows the V vs. V − I color−magnitude diagram of the cluster members from the Guarcello et al. (2010) catalog, with all the FLAMES targets indicated along with the 20 BWE stars analyzed here. (The error associated to V − I requested for the selection of the targets is <0.15 mag.)
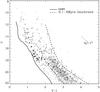 |
Fig. 1 V vs. V − I color−magnitude diagram of NGC 6611 members from the Guarcello et al. (2010) catalog (crosses). The 20 BWE stars analyzed here are marked with black filled circles, while the empty circles are all the targets observed with FLAMES. The solid and dashed lines are the ZAMS and the isochrone at 0.1−5 Myr, respectively (Siess et al. 2000). The reddening vector is also shown (Munari & Carraro 1996). Targets have been selected imposing V − I < 0.15 mag. |
The spectra analyzed in this program were obtained with the GIRAFFE/FLAMES at VLT instrument operating in MEDUSA mode using the HR15N setup. The spectra have a resolution R ≈ 17 000 and a signal-to-noise ratio S/N ≈ 20−90. The spectral range of this setup includes both the Li 6707.8 Å absorption line and the Hα 6563 Å emission line. The details on the FLAMES observations are summarized in Table 2.
Observations log.
3. Results
It is important to use independent criteria to confirm the origin of the BWE stars and their membership in NGC 6611. Here we focus mainly on the analysis of the Li and Hα lines, the radial velocity (RV), and vsin(i) measurements, also using the X-ray detection previously obtained.
3.1. Lithium equivalent width
The presence of a strong absorption Li line is commonly used as a membership criterion as indicative of the youth of stars. The evidence of a strong Li line is also a membership criterion for WTTSs (therefore it is a complementary criterion to the study of the Hα profile discussed in Sect. 3.2).
To subtract the background contribution from the sky, we computed the median of several (≈16−20) spectra of the sky for each observation during the same night (same OB) and subtracted it from the spectrum of the BWE analyzed (following the method of Jeffries & Oliveira 2005). After subtracting the median sky value, we corrected for the RV measurements (presented in Sect. 3.4). Then we combined the different OBs by summing the spectra to improve the S/N. To derive the equivalent width (EW) of the Li line of the BWE stars, EW(Li), we first normalized the spectrum of each BWE star to the continuum using the CONTINUUM task of IRAF in a small (10 Å) region centered on the Li absorption line at 6707.8 Å, using a second order Legendre function and a variable residual rejection limit. Then, we measured the EW(Li) by using the SPLOT task of IRAF. In particular, we fit the line with a Voigt profile if its EW is >100 mÅ and with a Gaussian if its EW is <100 mÅ. The contribution from the nearby Fe I line at 6707.441 Å blended with the Li line is negligible with respect to the EW(Li). In fact, following Soderblom et al. (1993), we find that EW(Fe) ranges between 5 and 70 mÅ, while the EW(Li) measured for the BWE stars showing significant Li absorption line is >180 mÅ. Therefore, we did not correct the EW(Li) for the contribution of the iron line. See Table 3 for the EW(Li) values derived for BWE stars with EW(Li) > 100 mÅ. The strongest Li lines detected have EW varying between ≈190−450 mÅ, values consistent with other very young clusters (e.g. Prisinzano et al. 2007). An example of a strong Li line is shown in Fig. 2 (see also Table 3).
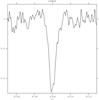 |
Fig. 2 The strong Li line in the BWE star 15 806. We have subtracted the median sky value, corrected for the RV measurements, and combined the different OBs by summing the spectra. |
We cannot derive the Li abundance since for these stars it is not trivial to derive a reliable estimate of the effective temperature spectroscopically. In fact, the temperatures can be derived classically from spectra in a wider spectral range: the spectra analyzed here do not show known spectral features suitable to deriving the temperature. Likewise, the effective temperatures derived from the observed colors are not reliable owing to the peculiar position of the BWE stars in the color−magnitude diagram that can be altered by the scattering and/or obscuration effects related to the presence of the disk as well as by the accretion process at work. Since we cannot constrain the position in the CMD for the BWE stars, we cannot derive the Li abundance.
We measured the EW(Li) of the BWE stars, focusing on those stars that show a strong absorption line. For those cases not showing an evident absorption Li line, we investigated whether this line can be affected by a veiling effect (which causes a shallowing or suppression of absorption lines), monitoring also other expected absorption lines in the region of the spectrum near the Li line. If there is evidence of accretion features in the Hα line profile, and if there are also only a few absorption lines observed in the spectrum, veiling effects could explain the reduction of the absorption lines. As an example, the BWE star 2062 suffers strong veiling effects. In fact, only one absorption line is visible in its spectrum (Fig. 3) at 6613 Å and is due to diffuse interstellar bands (DIB). In contrast, spectra of unveiled BWE stars show many absorption lines, such as a strong Li line (see Fig. 2).
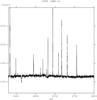 |
Fig. 3 Spectrum of the BWE star 2062 (excluding the spectral range near the Hα line shown in Fig. 5) as observed during the OBA-2. This star is strongly influenced by veiling effects, as discussed in the text. In fact, the only one absorption line present in its spectrum is due to diffuse interstellar bands. |
3.2. Hα profiles
We analyzed the Hα profiles to investigate whether the disks associated with the confirmed BWE members (see last column in Table 3 and discussion of membership in Sect. 4.1) are active or inert disks. For stars surrounded by active disks (i.e. with accretion and/or outflow processes still occurring), this emission line can in fact be a) symmetric, but show broad wings; or b) asymmetric. In extreme cases, a P Cygni profile (i.e. a line with a deep blue absorption, under the continuum level, indicating a wind at work) or an inverse P Cygni profile (i.e., a deep red absorption, under the continuum level, indicating infall on the central star) can occur.
Following Reipurth et al. (1996), the Hα line profile can be classified as 1) type I, if the line is symmetric; 2) type II if the line is asymmetric, with a second emission peak whose intensity is greater than half of the main peak; 3) type III if the line is asymmetric with the second peak intensity lower than half of the main peak; 4) type IV if the line is asymmetric and there is an absorption feature below the continuum level (P Cygni profile). These features can be observed in the blue (B) or red (R) parts of the main peak of the emission line. Therefore, a IV-R profile corresponds to the inverse P Cygni profile. Multiple profiles (indicated by “m”) can also occur. A possible physical explanation of these profile types is briefly discussed Sect. 4.3.
From the analysis of the Hα emission line profile and the comparison with the models, it is possible in general to estimate the accretion rate (White & Basri 2003; Muzerolle et al. 2003). Natta et al. (2004) find that the measurement of the width of the line at 10% of its peak, Hα10%, can be correlated to the accretion rate. However, this method cannot be used in the case of YSOs located near O stars, as in this case. Since their emission produces the formation of HII regions contributing to the Hα emission, the line can contain a nebular contribution, concentrated in the region near the peak, which is also spatially variable and cannot be easily measured independently. Therefore, a good subtraction of the nebular contribution to the emission near the Hα line cannot be achieved. This prevents us from measuring the EW(Hα) and the Hα10% of the star excluding the nebular component.
However, the contribution to the emission line from the nebula is narrow, while the CTTSs are expected to show a broad profile, since the Hα line can also show the motion of the surrounding gas. Therefore, we measured the full width at zero intensity (FWZI) of the Hα line and investigated its profile to select stars showing accretion or outflow signatures. The stars with spectra showing narrow Hα line (likely of nebular origin) are classified as candidate WTTSs, with an inert disk, since all the stars in the sample analyzed here are BWE, those with IR excesses by definition.
We analyzed the 50 Å range centered on the Hα emission line of the spectra. We normalized the spectra to the continuum level obtained by considering a second-order Legendre function and varying the residual rejection limit in the IRAF task CONTINUUM. We performed the FWZI measurements for each spectrum in all the different configuration IDs (see Table 2) to also investigate the emission variability, discussed in Sect. 3.3.
We considered the original spectra of the BWE stars without performing the sky subtraction. However, we have taken the nebular contribution to the Hα emission into account. In fact, we evaluated the λmin and λmax wavelength range within which the nebular emission dominates the Hα emission line. These values are quite consistent for all the OBs analyzed, ranging between 6561−6565 Å with an average width <3 Å.
In some cases, we can clearly recognize accretion/outflow activity in the Hα line, even if we cannot distinguish the central profile dominated by the nebular emission (e.g. located between the two vertical lines superimposed on Figs. 4 and 5). For example, the BWE star 2062 has a III-Bm or III-Rm profile1.
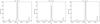 |
Fig. 4 Hα profiles of the 15 584 BWE star for all the OBs. For this object, even if we cannot distinguish the central profile, the Hα profile clearly suggests accretion/outflow activity. |
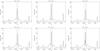 |
Fig. 5 Hα profiles of the 2062 BWE star for all the OBs. For this object, even if we cannot distinguish the central profile, the Hα profile clearly suggests accretion/outflow activity. |
Figure 6 shows the histogram of the profile types2 observed in the BWE stars analyzed here. Even if the profile type I (corresponding to no evidence for disk activity) is the most frequent (8 stars plus 3 variable), in many cases the emission line profile indicates clearly accretion/outflow processes at work. In fact, the IV-B profile is evident in many spectra (3 + 4 variable), followed by the III-B type (3 variable + 1 variable and within the nebular range). The III-R profile occurs twice (observed together with blue-shifted features); IV-R profile occurs once; II-B profile occurs once and it is variable. In two cases (11 751 and 1320) the spectra show a wide Hα absorption line (with narrow emission due to the nebular contribution), evidence that these objects are early stars, so no classification has been made for these stars.
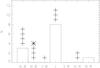 |
Fig. 6 Histogram of the Hα profile types. The crosses refer to the variable cases. The asterisks refer to the profile types different by the I type and not observable because of the nebular emission influence. |
3.3. Hα variability
The Hα line profiles are expected to be variable since the infall, as well as the outflow, are not stationary processes. To investigate this variability, we compared all the spectra of each OB (different nights, see Table 2) of the same star.
Table 3 shows the profile type for each BWE star analyzed here. Some stars show more than one profile type (also indicated in the table), suggesting a time variability of the Hα profile. Among the 20 BWE stars discussed here3, 12 do not show variability in the Hα emission line: eight show a type I profile, while in 4 cases the line shows a P Cygni (or inverse P Cygni) profile.
An example of a star showing variable emission line profile is 15 584, which varies from a III-Bm and a IV-Bm profile type. In the BWE star 2062 both intensity and position of the peaks vary, while the profile type is not variable (type III). The variability of the Hα emission line for the 15 584 and the 2062 BWE stars is shown in Figs. 4 and 5.
3.4. RV and v sini
To measure the radial velocity and projected rotational velocity for each BWE star, we used the FXCOR task of IRAF and performed a Fourier cross-correlation for each spectrum with respect to a template spectrum (following Tonry & Davis 1979). The template star was chosen among the stars without IR excess (not a BWE star), a “bona fide” photometric member with X-ray emission, with V − I within the range of the BWE stars (V − I = 1.2−2.2 mag, being (V − I) of the chosen template = 2.02 mag), and with a strong Li line. The position of the peak of the cross-correlation function gives a measurement of the radial velocity relative to the template (by selecting ranges without emission lines in the spectra).
We chose the object 1660 (see Fig. 7) as the template for deriving the RV and vsin(i). The star 1660 was observed in all the OBs (and shows features of accretion/ejection in the Hα profile but an adequate number of absorption lines to be used as a template). We compared the RV values derived using the star 1660 as template with those derived using another possible template, the star 16 250. We verified that the two templates provide consistent results. However, the template 1660 (V = 16.103 mag, spectrum OBB-23) is the best choice, since it allows us to obtain smaller associated errors.
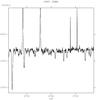 |
Fig. 7 Spectrum near the Li line (the strongest absorption line in this enlargement) of the template used to compute the RV and vsin(i) of all the BWE stars observed with FLAMES. |
The cross-correlation function (CCF) can also appear to be broad due to rotation effect, therefore its width is a measure of vsin(i) of the star, if the template shows the minimum broadening. We derived the projected rotational velocities for our sample by using the CCF widths and interpolating these values with the relation between the width of the cross-correlation function and the rotational velocities vsin(i) derived in Prisinzano et al. (2007) (by using synthetic spectra with spectral resolution very similar to that of our spectra). The error associated with the vsin(i) (following Rhode et al. 2001) is ± vsin(i)/(1 + r), where r is the Tonry & Davis (1979) parameter, which is a measure of the S/N of the peak of the CCF. The lower limit for the vsin(i) measure is 17 km s-1, since this is the instrumental resolution.
For all the BWE stars analyzed here, we measured the RV and vsin(i) of each single observation (each OB), in order to also search for possible variability in the timescales involved in our observations (almost one month). Table 3 shows our results. For those cases with spectra without enough absorption lines, we cannot derive reliable values. For these objects no value is indicated in Table 3.
The vsin(i) for most BWE stars are 20−40 km s-1, a result that is consistent with the nature of T Tauri stars. In addition, we found one case (star 4112) in which the cross-correlation function is not symmetric and can be fit with two Gaussians. This is an indication that this object is a double-lined spectroscopic binary (SB2).
In Table 3, the objects showing variability in their RV are highlighted in bold. A variable RV in different OBs (different nights) suggests that the star can be a binary system and this is the case for 8 objects.
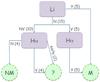 |
Fig. 8 Membership criteria used to confirm the BWE stars as members or nonmembers: Y = yes; N = no; V = veiling; NV = no veiling; M = member; NM = nonmember; ? = to be investigated further. Parenthesis shows the total number of objects for each case. |
Results for the 20 BWE stars discussed here for all the OBs.
4. Discussion
4.1. Membership
The criteria requested for a BWE star to be a candidate member of the NGC 6611 cluster are 1) the EW(Li) is greater than 100 mÅ, and 2) the Hα line profile indicates activity related to the accretion or outflow processes. A prominent absorption Li line demonstrates the PMS nature of the object, and the evidence of asymmetries and absorption features in the Hα emission line is a strong signature of an active disk surrounding the star. We also refer to previous detections of the stars in the X-ray band. As for the RV analysis, a value within 3σ with respect to the RV of the template chosen is a criterion that is not strong enough in this case to distinguish between members and nonmembers of the cluster because there could be strong contamination that prevents us from using this criterion.
To summarize the final membership of the BWE stars discussed here, we refer to the flow chart shown in Fig. 8. First of all, we check for evidence of the Li absorption line in the spectra and confirm the BWE star as a cluster member if the EW(Li) value is above the chosen threshold (“Y” in Table 3 and 5 stars in Fig. 8). This is a strong criterion (without considering other criteria to support the membership) because 1) the IR excesses detected in the BWE stars suggest the presence of a circumstellar disk and 2) a symmetric Hα emission line (type I profile) cannot exclude that the star is young. In fact, if the EW(Li) values derived are consistent with that object being a member of the cluster, but the Hα emission line profile does not show features related to the accretion or outflow process, we can conclude that the object under inspection is a member of the cluster with an inert disk. If the RV value of the object is not within 3σ with respect to the RV of the template, but the EW(Li) is above the threshold and there is also the detection of this object in X-rays (and this is true in 4 cases over the total of 5 BWE stars with evident Li), the star could be a binary member with the spectrum of just one component visible. Therefore, we do not reject this object as a member of the cluster.
If the EW(Li) measured from the spectra is below the chosen threshold (“N” in Table 3 and in Fig. 8, 15 cases), we distinguish two different cases: the Li line is not present possibly due to veiling (“V” in Fig. 8, 5 objects), or there is no evidence of veiling in the spectra (“NV” in Fig. 8, 10 objects). Then we check the Hα emission line profile of the star. If the Li line is not evident possibly due to veiling effects on the spectra and the Hα emission line profile is broad or asymmetric (“Y” in Table 3 and 5 stars in Fig. 8), then we consider this star as a member of the cluster. In fact, asymmetric features in this line is consistent with the presence of a circumstellar disk that can cause strong veiling effects due to accretion phenomena. If the Li line is not strong and there is no evidence of veiling, then: a) if there is not evidence of features related to accretion/outflow activity (“N” in Fig. 8, 4 cases), then this object is considered a nonmember; b) if the Hα emission line profile is broad or asymmetric (“Y” in Fig. 8), the object should be investigated further (“?" in Table 3 and 4 cases in Fig. 8); c) if the star is early-type (2 stars), the Li line is not expected to be strong, but the object should be further investigated (“?” in Table 3 and 2 cases in Fig. 8).
Following the considerations stated above, we can conclude that half of the sample analyzed here (10/20 objects) are confirmed members from our spectroscopic analysis of the BWE stars. In particular, among these ten BWE members, in five cases there is evidence of a strong Li absorption line, and four out of these five BWE stars with a strong Li line have also been detected in X-rays (15 805, 15 806, 13 310, and 15 584). The other BWE stars do not show X-ray detection (11 598 was not in the field of view of the X-ray observations); in five cases the Hα line criterion is fulfilled, while the Li line could be suppressed by veiling effects.
In six cases we cannot distinguish between members or nonmembers (“?” in Table 3 and in Fig. 8), since in four cases, there is no evidence of a strong Li line or of veiling effects even if there are suggestions of accretion/outflow processes in the Hα line; in two cases the Hα line analysis suggests these objects are early-type stars (so we expect the Li line is not present in these stars).
Four cases are not confirmed as members of the NGC 6611 cluster, since in these objects both criteria are not fulfilled.
4.2. Binarity
As explained in Sect. 4.1, we do not consider the RV value consistent with the template as a strong membership criterion. However, we use the variability of RV to check the binarity of the BWE stars. From our analysis we find that eight BWE stars among the total of 20 can be binary systems. In particular, the star 4112 is possibly an SB2 because its cross correlation function has a double-peaked profile. Among these eight binary stars three are confirmed members of NGC 6611; for three cases we cannot distinguish between member or nonmember; two objects are not members of the cluster.
4.3. Accretion properties: the physical origin of the Hα profiles
To study the accretion properties of the BWE stars, we focused on the Hα line profiles observed with FLAMES. In general, the Hα line profiles of young stars consist of a symmetrical emission line with one or more absorbing components superimposed, as anticipated in Sect. 3.2. Here we investigate the physical origin of the Hα profile types detected in the BWE stars, following Reipurth et al. (1996). The Hα line consists of several components to which different regions (characterized by different dynamical and physical conditions) contribute. Magnetically driven winds can explain the central and the blue-shifted absorption. On the other hand, the free fall of material from the disk onto the star (led by a magnetic field) causes the infalling gas to reach velocities up to several hundred km s-1, decelerated in strong shocks, which can explain the asymmetry of the Hα line due to a red-shifted absorption component. Models of winds accelerated close to the star as blobs and then decelerated can reproduce the double peaks observed. Therefore, type IV-B or P Cygni profiles can be explained by models of spherical winds, while type III-B profiles are reproduced by stochastic decelerating wind models. Infall material can explain type II and III-R profiles if different parameters are used in the model (see all the profile type first presented in Sect. 3.2).
Kurosawa et al. (2006) also interpret the profile types defined in Reipurth et al. (1996) in terms of inclination and accretion/outflow activity. In particular, the type II-B can be reproduced by models with medium-to-high inclinations and are due to fast wind acceleration. The difference between Type II-R profile and type II-B is interpreted as a geometrical effect corresponding to different viewing angles. Type III-B profiles are reproduced by models with moderate inclination and due to fast wind acceleration, while type III-R are associated with high inclination (the disk obscures the central emission). The classical P Cygni profile (type IV-B) where the component due to the absorption in the blue has high enough velocity to be beyond the emission line wing can be explained with a bipolar flow observed along its axis, while the inverse P Cygni profile (type IV-R) is related to the lowest mass-accretion rates at high inclinations.
In the context of the BWE stars detected in NGC 6611 and analyzed here, absorption features superimposed on the emission line have been detected in ten BWE stars, and lead to the profile types II, III, or IV. In some cases the type I profile can also be asymmetric itself indicating activity of the surrounding disk, and this occurs in the BWE star 1336 (see also Table 3). The absorption can be due to material with a wide range of velocities. In fact, the dips observed can be narrow (as in the case of 11 532, OBA) or broad (e.g. 2062). The multiple profiles (“m”) are characterized by several dips or absorption features (as in the BWE star 15 584).
4.4. BWE stars: old members?
There are several interpretations of the nature of the BWE stars (see Sect. 1). A qualitative analysis of the SEDs of this sample of stars suggests that obscuration or scattering due to the presence of the surrounding disk can explain the observed colors of some BWE stars. On the other hand, these BWE stars could actually be cluster members that are significantly older than the mean cluster age (suggesting an age spread as in Palla et al. 2005), that is to say, a first generation of cluster members yet surrounded by a circumstellar disk. In this case, their colors are purely photospheric; in fact, there are other examples of CTTSs older than the typical lifetime of the disk (e.g., MP Mus, Argiroffi et al. 2007). Our data do not allow us to discard this hypothesis since the EW of the Li is compatible with that of stars where a partial (less than a factor 10) Li depletion occurred. On the other hand, given the absence of molecular bands, our targets are certainly stars with spectral type earlier than or equal to K stars for which a partial and slow Li depletion is expected up to 10 Myr. Nevertheless, the measured EW of the Li cannot be converted accurately in Li abundances since the effective temperatures of these objects cannot be derived with available data, and we are thus not able to constrain their ages by using the Li depletion timescale inferred by stellar models.
5. Summary and conclusions
In this paper, we have investigated the nature of the BWE stars. This is a group of candidate members of young clusters that show IR excesses, which is the signature of the presence of a circumstellar disk, but it has a photometric position inconsistent with the locus defined by the young cluster members. Here we have reported the spectroscopic analysis of twenty BWE stars observed with FLAMES to confirm their membership in the NGC 6611 cluster and to understand the origin of their position in the CMD.
We analyzed the Hα profiles and found that in 10 stars the emission line shows absorption features or asymmetry, indicative of the presence of an active disk. In summary, half of the analyzed BWE stars present accretion and outflow with various characteristics. From the study of the Li line, we derived that in five cases there is evidence of a strong absorption Li line, suggesting that these are young objects. The study of the RV allowed us to infer the binarity of eight BWE stars, three of which confirmed as members of the cluster.
We took advantage of the spectroscopic results derived from the analysis of the Li absorption line and the Hα profiles to confirm the membership of the BWE stars in NGC 6611. Ten (50% of the total sample) BWE stars have been confirmed as members of the cluster. Among these, we interpreted the four stars showing Hα type I profiles (12 168, 13 310, 15 805, and 15 806) as WTTSs with an inert disk. The six other confirmed members have IV-B profiles or variable III m or IV-B profile types, therefore these BWE stars can be classified as CTTSs with active accretion disks. The Hα profiles observed in the six cases where the membership is uncertain suggest: in two cases that the objects are early-type stars; in four cases the presence of accretion or outflow activity (with absorption feature in the blue and red parts of the wings). Therefore, the latter could be classified as CTTSs with active accretion disks, if confirmed as members of the cluster.
The origin of the peculiar position of the BWE stars in the color−magnitude diagram can be explained by the scattering and/or obscuration effects related to the presence of the disk, as well as by the accretion process at work. On the other hand, we cannot exclude the hypothesis that there is an older population of the cluster (De Marchi et al., in prep.), but we can conclude
unambiguously that about half of the BWE stars are members of the cluster. In conclusion, a robust result of our work was, in fact, that the spectroscopic analysis (as in this case, using FLAMES data) of BWE stars unambiguously demonstrates that half (10 stars out of the total 20 stars of the selected sample) of BWE stars has been confirmed as members of the cluster, with six more objects that are possible members as well.
Several young clusters, apart from NGC 6611 discussed here, host stars with blue optical colors consistent with field stars or old cluster members, as Orion nebula cluster (Palla & Stahler 2000), NGC 6530 (Prisinzano et al. 2005), NGC 2264 (Flaccomio et al. 2000), NGC 1893 (Prisinzano et al. 2011). Our analysis suggests that not including the BWE stars in the membership of young clusters with high disk fraction results in incomplete membership and that the investigation of the spectroscopic properties of the BWE stars can be of general interest for studying young clusters.
We cannot distinguish between the cases of II and III profiles, either R or B, in general, if this profile lies within the nebular range.
See also Sect. 3.3, where we account for the variability in the profiles.
Excluding the two early-type stars, 11 751 and 1320, see Table 3.
Acknowledgments
We would like to thank the referee for her/his useful comments. This work was supported in part by Agenzia Spaziale Italiana under contract No. ASI-INAF (I/009/10/0). L.P. and G.M. acknowledge the PRIN-INAF (PI. Desidera) for financial support. M.G.G. is supported by the Chandra grant GO0-11040X. We would like to thank Dr. D. Randazzo for her suggestions during the preparation of the manuscript.
References
- Allen, L. E., Calvet, N., D’Alessio, P., et al. 2004, ApJS, 154, 363 [NASA ADS] [CrossRef] [Google Scholar]
- Argiroffi, C., Maggio, A., & Peres, G. 2007, A&A, 465, L5 [NASA ADS] [CrossRef] [EDP Sciences] [Google Scholar]
- Ballesteros-Paredes, J., & Hartmann, L. 2007, Rev. Mex. Astron. Astrofis., 43, 123 [NASA ADS] [Google Scholar]
- Bodenheimer, P. 1965, ApJ, 142, 451 [NASA ADS] [CrossRef] [Google Scholar]
- Damiani, F., Prisinzano, L., Micela, G., & Sciortino, S. 2006, A&A, 459, 477 [NASA ADS] [CrossRef] [EDP Sciences] [Google Scholar]
- Flaccomio, E., Micela, G., Sciortino, S., et al. 2000, A&A, 355, 651 [NASA ADS] [Google Scholar]
- Guarcello, M. G., Prisinzano, L., Micela, G., et al. 2007, A&A, 462, 245 [NASA ADS] [CrossRef] [EDP Sciences] [Google Scholar]
- Guarcello, M. G., Micela, G., Damiani, F., et al. 2009, A&A, 496, 453 [NASA ADS] [CrossRef] [EDP Sciences] [Google Scholar]
- Guarcello, M. G., Damiani, F., Micela, G., et al. 2010, A&A, 521, A18 [NASA ADS] [CrossRef] [EDP Sciences] [Google Scholar]
- Hartmann, L. W., & Kenyon, S. J. 1990, ApJ, 349, 190 [NASA ADS] [CrossRef] [Google Scholar]
- Hartmann, L., Calvet, N., Gullbring, E., & D’Alessio, P. 1998, ApJ, 495, 385 [NASA ADS] [CrossRef] [Google Scholar]
- Hillenbrand, L. A. 1997, AJ, 113, 1733 [NASA ADS] [CrossRef] [Google Scholar]
- Indebetouw, R., Robitaille, T. P., Whitney, B. A., et al. 2007, ApJ, 666, 321 [NASA ADS] [CrossRef] [Google Scholar]
- Jeffries, R. D., & Oliveira, J. M. 2005, MNRAS, 358, 13 [NASA ADS] [CrossRef] [Google Scholar]
- Kurosawa, R., Harries, T. J., & Symington, N. H. 2006, MNRAS, 370, 580 [NASA ADS] [CrossRef] [Google Scholar]
- Munari, U., & Carraro, G. 1996, A&A, 314, 108 [NASA ADS] [Google Scholar]
- Muzerolle, J., Hillenbrand, L., Calvet, N., Briceño, C., & Hartmann, L. 2003, ApJ, 592, 266 [NASA ADS] [CrossRef] [Google Scholar]
- Natta, A., Testi, L., Muzerolle, J., et al. 2004, A&A, 424, 603 [NASA ADS] [CrossRef] [EDP Sciences] [Google Scholar]
- Oliveira, J. M., Jeffries, R. D., van Loon, J. T., Littlefair, S. P., & Naylor, T. 2005, MNRAS, 358, L21 [NASA ADS] [Google Scholar]
- Palla, F., & Stahler, S. W. 2000, ApJ, 540, 255 [NASA ADS] [CrossRef] [Google Scholar]
- Palla, F., Randich, S., Flaccomio, E., & Pallavicini, R. 2005, ApJ, 626, L49 [NASA ADS] [CrossRef] [Google Scholar]
- Prisinzano, L., Damiani, F., Micela, G., & Sciortino, S. 2005, A&A, 430, 941 [NASA ADS] [CrossRef] [EDP Sciences] [Google Scholar]
- Prisinzano, L., Damiani, F., Micela, G., & Pillitteri, I. 2007, A&A, 462, 123 [NASA ADS] [CrossRef] [EDP Sciences] [Google Scholar]
- Prisinzano, L., Sanz-Forcada, J., Micela, G., et al. 2011, A&A, 527, A77 [NASA ADS] [CrossRef] [EDP Sciences] [Google Scholar]
- Reipurth, B., Pedrosa, A., & Lago, M. T. V. T. 1996, A&AS, 120, 229 [NASA ADS] [CrossRef] [EDP Sciences] [Google Scholar]
- Rhode, K. L., Herbst, W., & Mathieu, R. D. 2001, AJ, 122, 3258 [NASA ADS] [CrossRef] [Google Scholar]
- Sacco, G. G., Franciosini, E., Randich, S., & Pallavicini, R. 2008, A&A, 488, 167 [NASA ADS] [CrossRef] [EDP Sciences] [Google Scholar]
- Shu, F. H., Adams, F. C., & Lizano, S. 1987, ARA&A, 25, 23 [Google Scholar]
- Siess, L., Dufour, E., & Forestini, M. 2000, A&A, 358, 593 [NASA ADS] [Google Scholar]
- Soderblom, D. R., Jones, B. F., Balachandran, S., et al. 1993, AJ, 106, 1059 [NASA ADS] [CrossRef] [Google Scholar]
- Tassis, K., & Mouschovias, T. C. 2004, ApJ, 616, 283 [NASA ADS] [CrossRef] [Google Scholar]
- Throop, H. B., Bally, J., Esposito, L. W., & McCaughrean, M. J. 2001, Science, 292, 1686 [NASA ADS] [CrossRef] [PubMed] [Google Scholar]
- Tonry, J., & Davis, M. 1979, AJ, 84, 1511 [NASA ADS] [CrossRef] [Google Scholar]
- White, R. J., & Basri, G. 2003, ApJ, 582, 1109 [NASA ADS] [CrossRef] [Google Scholar]
All Tables
All Figures
|
Fig. 1 V vs. V − I color−magnitude diagram of NGC 6611 members from the Guarcello et al. (2010) catalog (crosses). The 20 BWE stars analyzed here are marked with black filled circles, while the empty circles are all the targets observed with FLAMES. The solid and dashed lines are the ZAMS and the isochrone at 0.1−5 Myr, respectively (Siess et al. 2000). The reddening vector is also shown (Munari & Carraro 1996). Targets have been selected imposing V − I < 0.15 mag. |
| In the text | |
|
Fig. 2 The strong Li line in the BWE star 15 806. We have subtracted the median sky value, corrected for the RV measurements, and combined the different OBs by summing the spectra. |
| In the text | |
|
Fig. 3 Spectrum of the BWE star 2062 (excluding the spectral range near the Hα line shown in Fig. 5) as observed during the OBA-2. This star is strongly influenced by veiling effects, as discussed in the text. In fact, the only one absorption line present in its spectrum is due to diffuse interstellar bands. |
| In the text | |
|
Fig. 4 Hα profiles of the 15 584 BWE star for all the OBs. For this object, even if we cannot distinguish the central profile, the Hα profile clearly suggests accretion/outflow activity. |
| In the text | |
|
Fig. 5 Hα profiles of the 2062 BWE star for all the OBs. For this object, even if we cannot distinguish the central profile, the Hα profile clearly suggests accretion/outflow activity. |
| In the text | |
|
Fig. 6 Histogram of the Hα profile types. The crosses refer to the variable cases. The asterisks refer to the profile types different by the I type and not observable because of the nebular emission influence. |
| In the text | |
|
Fig. 7 Spectrum near the Li line (the strongest absorption line in this enlargement) of the template used to compute the RV and vsin(i) of all the BWE stars observed with FLAMES. |
| In the text | |
|
Fig. 8 Membership criteria used to confirm the BWE stars as members or nonmembers: Y = yes; N = no; V = veiling; NV = no veiling; M = member; NM = nonmember; ? = to be investigated further. Parenthesis shows the total number of objects for each case. |
| In the text | |
Current usage metrics show cumulative count of Article Views (full-text article views including HTML views, PDF and ePub downloads, according to the available data) and Abstracts Views on Vision4Press platform.
Data correspond to usage on the plateform after 2015. The current usage metrics is available 48-96 hours after online publication and is updated daily on week days.
Initial download of the metrics may take a while.