Fig. 3
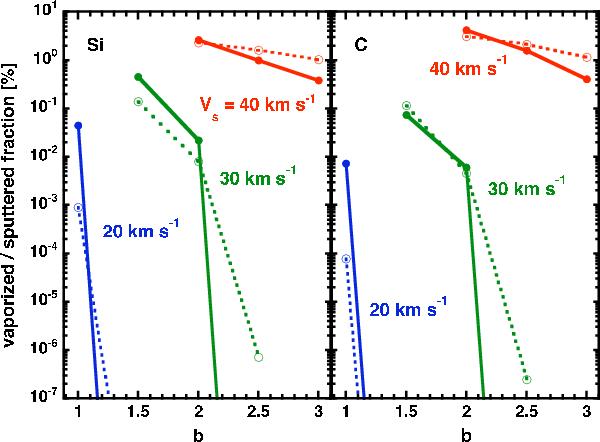
Fractions of Si (left panel) and C (right panel)
released from grain cores in model M1 of Table 2 by vaporization (full lines) and sputtering (broken lines), for
Vs = 20 km s-1 (blue),
Vs = 30 km s-1 (green), and
Vs = 40 km s-1 (red), as functions of the
magnetic field parameter, b, in
 .
.
Current usage metrics show cumulative count of Article Views (full-text article views including HTML views, PDF and ePub downloads, according to the available data) and Abstracts Views on Vision4Press platform.
Data correspond to usage on the plateform after 2015. The current usage metrics is available 48-96 hours after online publication and is updated daily on week days.
Initial download of the metrics may take a while.