Fig. 6
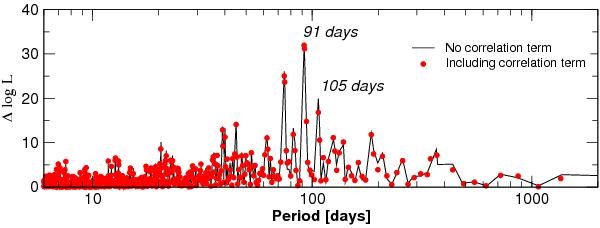
Log-likelihood periodograms for planet d (91 days) including the correlation term (red dots) compared to the original periodogram without this term (black line). The inclusion of the correlation term increases the contrast between the peaks at 91 and 105 days, favoring the interpretation of the 91 days signals as a genuine planet candidate.
Current usage metrics show cumulative count of Article Views (full-text article views including HTML views, PDF and ePub downloads, according to the available data) and Abstracts Views on Vision4Press platform.
Data correspond to usage on the plateform after 2015. The current usage metrics is available 48-96 hours after online publication and is updated daily on week days.
Initial download of the metrics may take a while.