Fig. 5
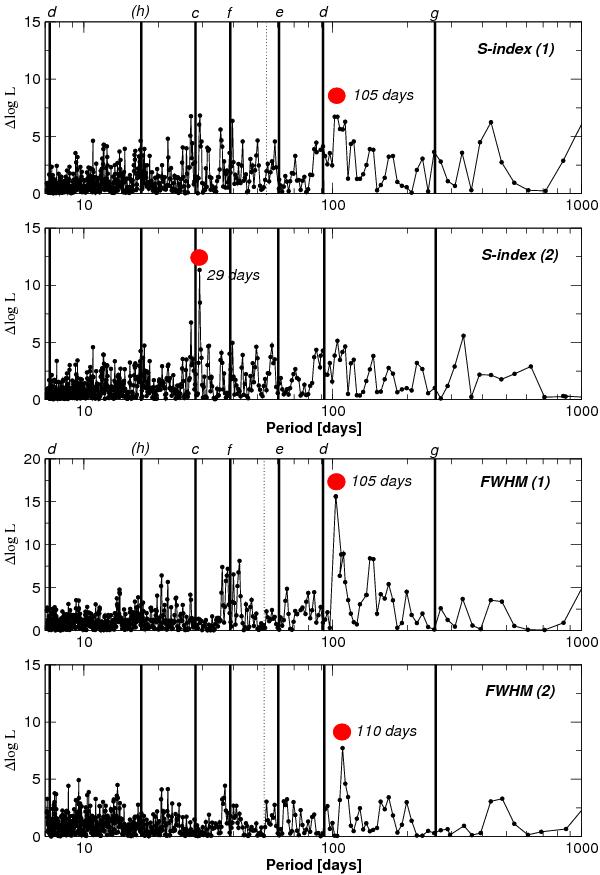
Top two panels. Log-L periodograms for up to 2 signals in the S-index. The most likely periods of the proposed planet candidates are marked as vertical lines. Bottom two panels. Log-L periodograms for up to 2 signals in the FWHM. Given the proximity of these two signals, it is possible that both of them originate from the same feature (active region corotating with the star) that is slowly evolving with time.
Current usage metrics show cumulative count of Article Views (full-text article views including HTML views, PDF and ePub downloads, according to the available data) and Abstracts Views on Vision4Press platform.
Data correspond to usage on the plateform after 2015. The current usage metrics is available 48-96 hours after online publication and is updated daily on week days.
Initial download of the metrics may take a while.