Fig. 12
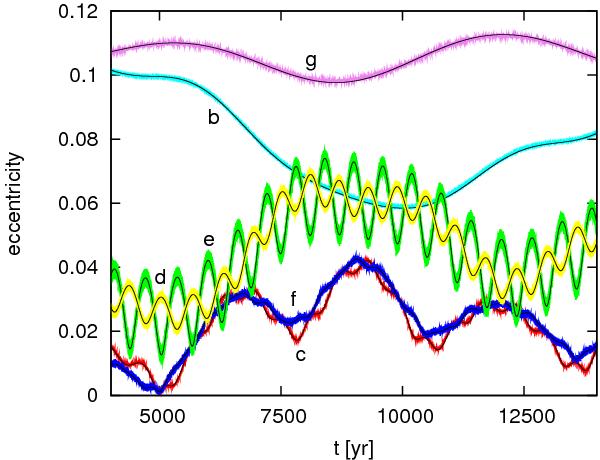
Evolution of the eccentricities of solution S6. Colored lines give the eccentricity as obtained from a numerical integration. The thin black lines show the eccentricity of the respective planet as given by the linear, secular approximation. Close to each line we give the name of the corresponding planet.
Current usage metrics show cumulative count of Article Views (full-text article views including HTML views, PDF and ePub downloads, according to the available data) and Abstracts Views on Vision4Press platform.
Data correspond to usage on the plateform after 2015. The current usage metrics is available 48-96 hours after online publication and is updated daily on week days.
Initial download of the metrics may take a while.