Fig. 10
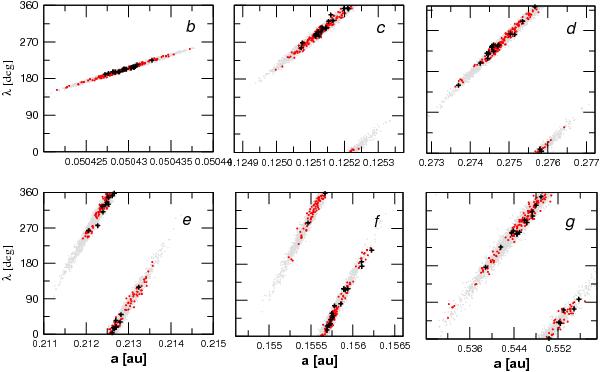
Result of the stability analysis of 80 000 six-planet solutions in the plane of initial semi-major axis a vs. initial mean longitude λ obtained from a numerical integration over T ≈ 7000 years. Each initial condition is represented as a point. Initial conditions leading to an immediate disintegration of the system are shown as gray dots. Initial conditions that lead to stable motion for at least 1 Myr are shown as red points (D < 10-5). Black crosses represent the most stable solutions (D < 10-6), and can last over many Myr.
Current usage metrics show cumulative count of Article Views (full-text article views including HTML views, PDF and ePub downloads, according to the available data) and Abstracts Views on Vision4Press platform.
Data correspond to usage on the plateform after 2015. The current usage metrics is available 48-96 hours after online publication and is updated daily on week days.
Initial download of the metrics may take a while.