Fig. 1
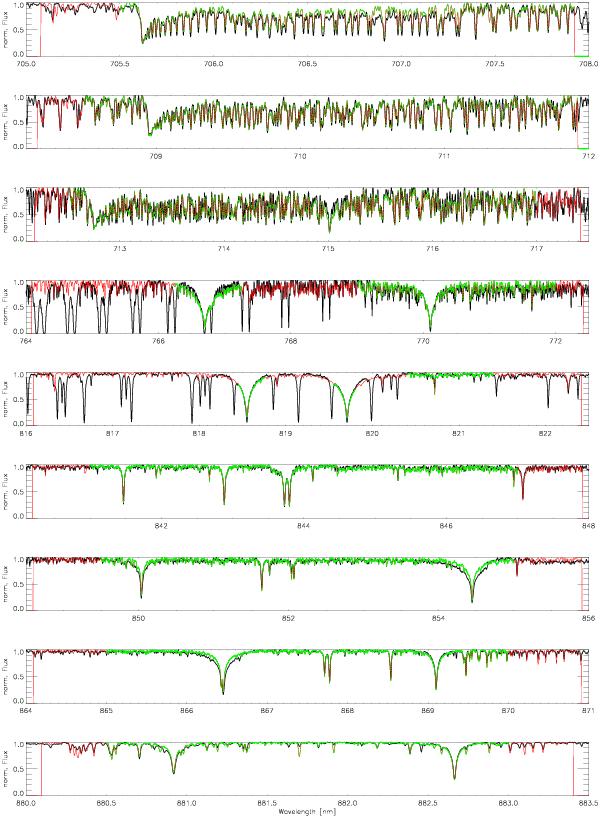
Snapshots of the wavelength regions used in the spectral fit to the UVES spectrum of GJ 667C. The observed spectrum is represented in black, the green curves are the parts of the synthetic spectrum used in the fit. The red lines are also from the synthetic spectrum that were not used to avoid contamination by telluric features or because they did not contain relevant spectroscopic information. Unfitted deep sharp lines – especially on panels four and five from the top of the page – are non-removed telluric features.
Current usage metrics show cumulative count of Article Views (full-text article views including HTML views, PDF and ePub downloads, according to the available data) and Abstracts Views on Vision4Press platform.
Data correspond to usage on the plateform after 2015. The current usage metrics is available 48-96 hours after online publication and is updated daily on week days.
Initial download of the metrics may take a while.