Fig. 5
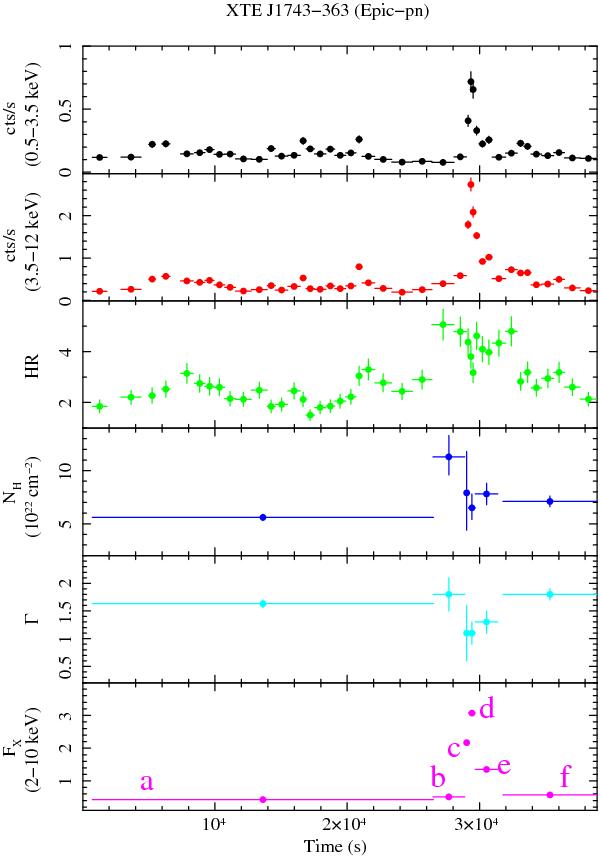
First two panels from the top show the source lightcurves of Fig. 2 rebinned adaptively to a S/N = 9 (based on the lightcurve in the 0.3−3.5 keV energy band). The third panel from the top shows the HR, calculated as the ratio between the source count-rate in the 3.5–12 keV vs. count-rate in the 0.3–3.5 keV energy band. The other three panels show the absorption column density (NH), the power-law photon index (Γ), and the observed flux (units of 10-11 erg/cm2/s) in different time intervals as revealed from our time-resolved spectral analysis (see text for details).
Current usage metrics show cumulative count of Article Views (full-text article views including HTML views, PDF and ePub downloads, according to the available data) and Abstracts Views on Vision4Press platform.
Data correspond to usage on the plateform after 2015. The current usage metrics is available 48-96 hours after online publication and is updated daily on week days.
Initial download of the metrics may take a while.