Fig. 5
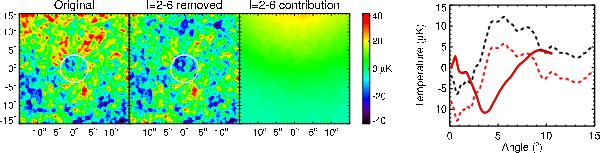
Stacking of the Gr08 voids done (from left to right) on the cleaned WMAP V map, on the same map without its ℓ = 2–6 multipoles, and on these multipoles only. The temperature (dotted curves) and photometry (solid) profiles shown in the rightmost plot are obtained from the first (black curves) and second (red) stacked images. The temperature offset induced by the removed multipoles does not affect the photometry.
Current usage metrics show cumulative count of Article Views (full-text article views including HTML views, PDF and ePub downloads, according to the available data) and Abstracts Views on Vision4Press platform.
Data correspond to usage on the plateform after 2015. The current usage metrics is available 48-96 hours after online publication and is updated daily on week days.
Initial download of the metrics may take a while.