Fig. 4
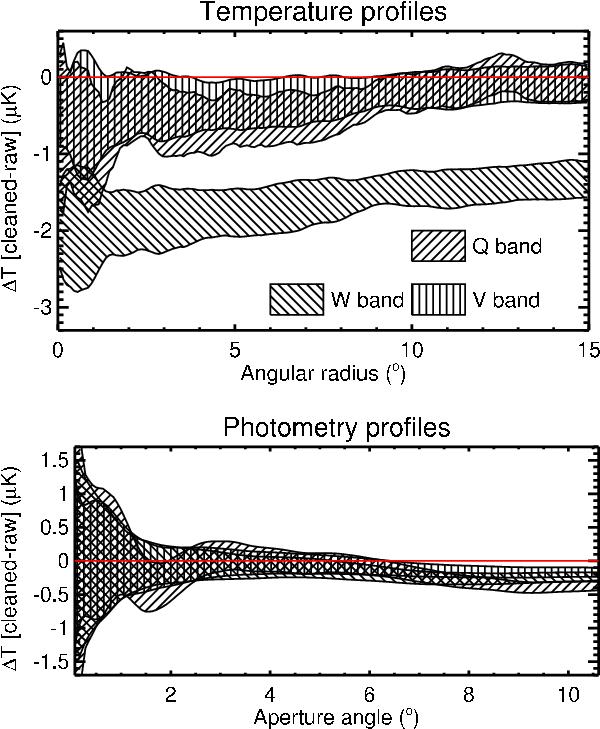
For the Gr08 stacking, differences in the temperature (top) and photometry (bottom) profiles between foreground-cleaned maps and raw maps, for the three frequency bands considered. The width of the shaded curves corresponds to statistical errors on the profile measurements. The quasi-flat offsets observed in the temperature profiles do not affect the photometry substantially.
Current usage metrics show cumulative count of Article Views (full-text article views including HTML views, PDF and ePub downloads, according to the available data) and Abstracts Views on Vision4Press platform.
Data correspond to usage on the plateform after 2015. The current usage metrics is available 48-96 hours after online publication and is updated daily on week days.
Initial download of the metrics may take a while.