Fig. 9
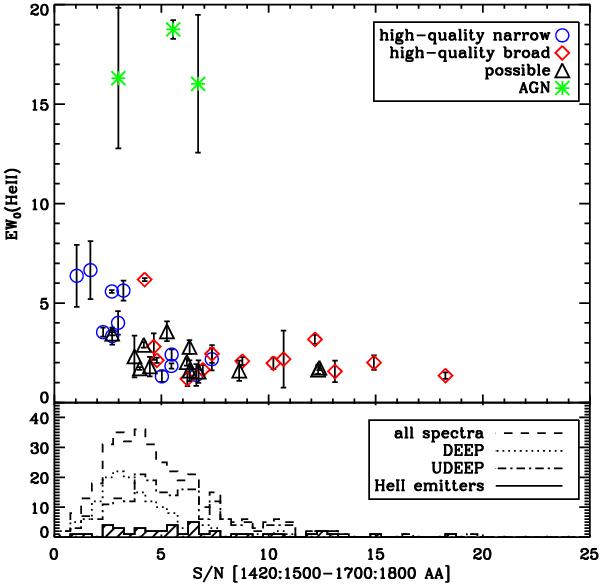
Top panel: rest-frame equivalent width of the He II λ1640 line as a function of the average S/N per resolution element of the spectra in the two regions 1420–1500 Å and 1700–1800 Å for the 39 galaxies with detected He II in emission. The blue circles, red diamonds, black triangles, and green asterisks represent the reliable emitters with narrow He II lines, the reliable emitters with broad He II lines, the possible emitters, and the objects classified as AGN, respectively. Bottom panel: histogram of the average S/N at 1420–1500 Å and 1700–1800 Å for all 277 galaxies in the sample (long dashed line), for the DEEP and UDEEP spectra (dotted and dot-dashed, respectively), and for the 39 galaxies with He II in emission (continuous filled histogram).
Current usage metrics show cumulative count of Article Views (full-text article views including HTML views, PDF and ePub downloads, according to the available data) and Abstracts Views on Vision4Press platform.
Data correspond to usage on the plateform after 2015. The current usage metrics is available 48-96 hours after online publication and is updated daily on week days.
Initial download of the metrics may take a while.