Fig. 3
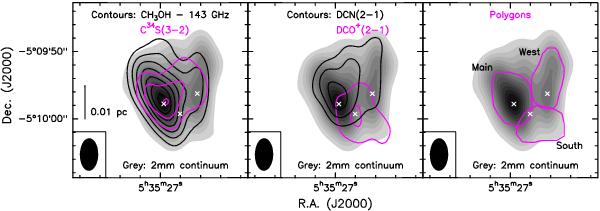
Velocity-integrated PdBI contour maps obtained towards OMC-2 FIR 4, overlaid on the naturally weighted continuum map (grey scale). The bottom-left ellipse in each panel represents the beam size. Left: CH3OH(3, 1, +0 – 2, 1, +0) (black) and C34S(3–2) (magenta). Centre: DCN(2–1) (black) and DCO+(2–1) (magenta). All the contours start at 3σ and increase by steps of 3σ. The 1σ rms values are 0.16, 0.14, 0.17, and 0.08 Jy beam-1 km s-1, respectively for the CH3OH, C34S(3–2), DCN(2–1), and DCO+(2–1) integrated maps. Right: Polygons representing the three differentiated components, main, west, and south (see text), used to extract average spectra. The white crosses mark the positions of the three sources identified in this work (see Table 4).
Current usage metrics show cumulative count of Article Views (full-text article views including HTML views, PDF and ePub downloads, according to the available data) and Abstracts Views on Vision4Press platform.
Data correspond to usage on the plateform after 2015. The current usage metrics is available 48-96 hours after online publication and is updated daily on week days.
Initial download of the metrics may take a while.