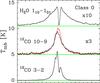
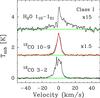
Fig. 4

Composite H2O 110–101, CO 10–9 and CO 3–2 spectra of Class 0 and Class I sources averaged in order to compare the line profiles of two types of sources. All spectra are rescaled to a common distance of 200 pc, shifted to the central 0 km s-1 velocity, rebinned to a 0.3 km s-1 velocity resolution. The CO spectra refer to a 20′′ beam, the H2O spectra to a 40′′ beam. The red spectra overlaid on top of the 12CO 10–9 are obtained by normalizing all the spectra to a common peak temperature first and then averaging them.
Current usage metrics show cumulative count of Article Views (full-text article views including HTML views, PDF and ePub downloads, according to the available data) and Abstracts Views on Vision4Press platform.
Data correspond to usage on the plateform after 2015. The current usage metrics is available 48-96 hours after online publication and is updated daily on week days.
Initial download of the metrics may take a while.