Free Access
Fig. 19
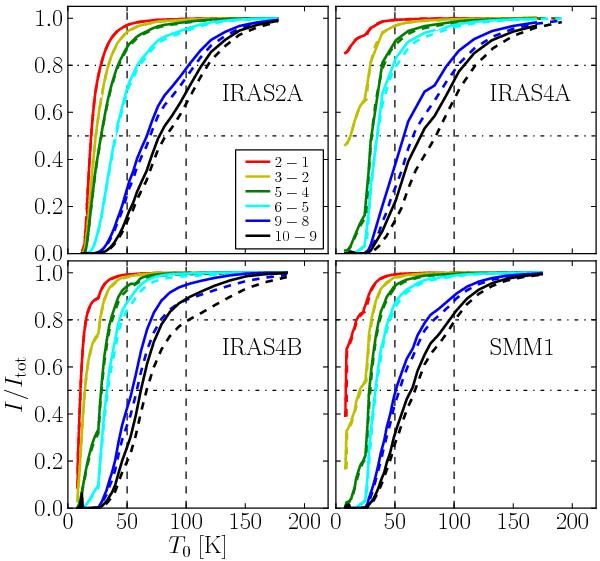
Cumulative intensity I/Itot for various C18O lines as function of envelope radius (as indicated by the temperature To) with the dust opacity included (solid curves), and dust opacity off (dashed curves). The dash-dotted lines indicates the fractions of 50 and 80%, respectively.
Current usage metrics show cumulative count of Article Views (full-text article views including HTML views, PDF and ePub downloads, according to the available data) and Abstracts Views on Vision4Press platform.
Data correspond to usage on the plateform after 2015. The current usage metrics is available 48-96 hours after online publication and is updated daily on week days.
Initial download of the metrics may take a while.