Fig. 17
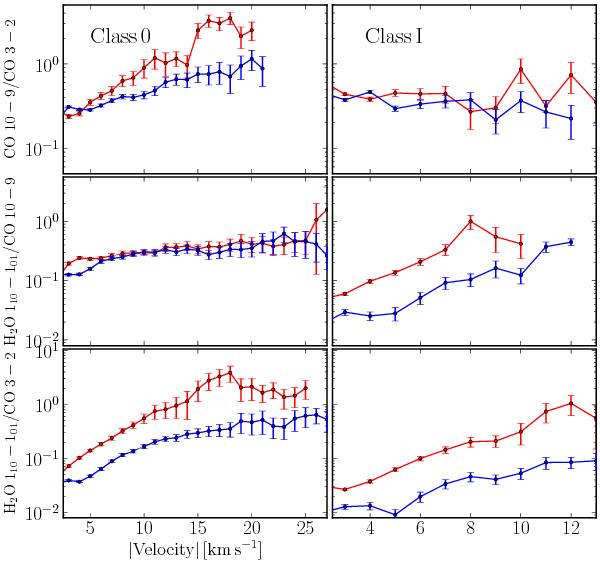
Blue and red line wing ratios of CO 10–9/3–2 (top panel), H2O 110–101/CO 10–9 (middle panel), and H2O 110–101/CO 3–2 (bottom panel) for the composite Class 0 and Class I source spectra. The H2O/CO 10–9 and H2O/CO 3–2 ratios are a factor of two lower than shown in Fig. 4 due to the beam size difference of 20″ (CO 10–9 lines) to 40″ (H2O 110–101 lines).
Current usage metrics show cumulative count of Article Views (full-text article views including HTML views, PDF and ePub downloads, according to the available data) and Abstracts Views on Vision4Press platform.
Data correspond to usage on the plateform after 2015. The current usage metrics is available 48-96 hours after online publication and is updated daily on week days.
Initial download of the metrics may take a while.